SciTech-Mathematics-Probability+Statistics-Distribution: PDF(Probability Distribution Function) for CDF(cumulative distribution function) or PDF(probability density function)
SciTech-Mathematics-Probability+Statistics-Distribution:
PDF(Probability Distribution Function)
https://ww2.mathworks.cn/help/stats/probabilitydistributionfunctiontool.html
Required Products
- MATLAB®
- Statistics and Machine Learning Toolbox™
Note: disttool does not provide printing, code generating, or data importing functionality in MATLAB Online™.
Description
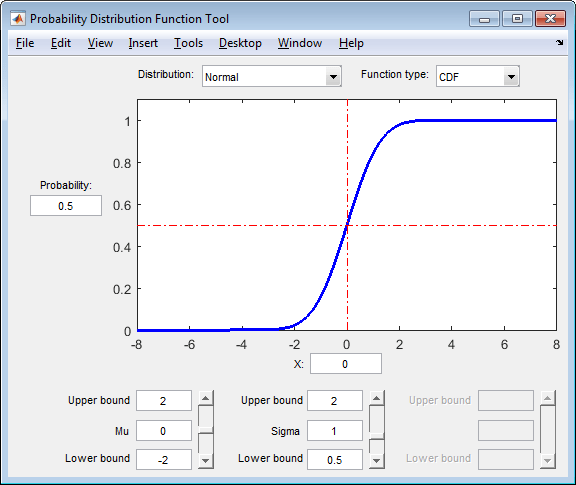
The PDF(Probability Distribution Function) tool creates an interactive plot of the CDF(cumulative distribution function) or PDF(probability density function) for a probability distribution.
Explore the effects of changing parameter values on the shape of the plot,
either by specifying parameter values or using interactive sliders.
Parameters
-
Distribution — Probability distribution
Normal(default) |Exponential|Poisson|Weibull|...
Specify the probability distribution to explore by selecting a distribution name from the drop-down list.
The drop-down list includes approximately 25 probability distribution options,
including Normal, Exponential, Poisson, Weibull, and more. -
Function type — Probability distribution function type
CDF(default) |PDF
Specify the probability distribution function type as:- CDF (cumulative distribution function)
- PDF (probability density function)
by selecting the function name from the drop-down list.
-
Probability — Cumulative distribution function value
numeric valueinthe range [0,1]
Specify the CDF(cumulative distribution function) value of interest as a numeric value in the range [0,1]. The corresponding random variable value appears in the X field below the plot.
Alternatively, you can specify a value for X, and the Probability value will update automatically.
This option only appears if Function type is CDF. If Function type is PDF, then the probability density at the specified X valuedisplays to the left of the plot. -
X — Random variable
numeric value
Specify the random variable of interest as a numeric value.- If the Function type is CDF, then the corresponding CDF(cumulative distribution function) value appears in the Probability field to the left of the plot. Alternatively, you can specify a value for Probability, and the X value will update automatically.
- If the Function type is PDF, then the corresponding probability density value appears to the left of the plot.
-
Parameters — Parameter boundaries and values
numeric value
Specify the parameter boundaries and values as numeric values.- Each column contains a field for the upper bound, value, and lower bound of one parameter.
- The name and number of available parameters
changes based onthe distribution specified in the Distribution drop-down list.
For example,- if you
selectthe Normal distribution, then disttool enables two columns:- one column for the Mu parameter
- one column for the Sigma parameter.
- If you select the Exponential distribution, then disttool enables one column:
- one column for the Mu parameter.
- if you
Tips
To change the value of X (on the y-axis), or Probability or Density (on the x-axis):
- Type the values of interest into the Probability or X fields;
Clickon the point of interest on the plot; or
Click and dragthe reference lines across the plot.