54-Kubernetes集群资源监控-监控指标和方案
集群资源监控
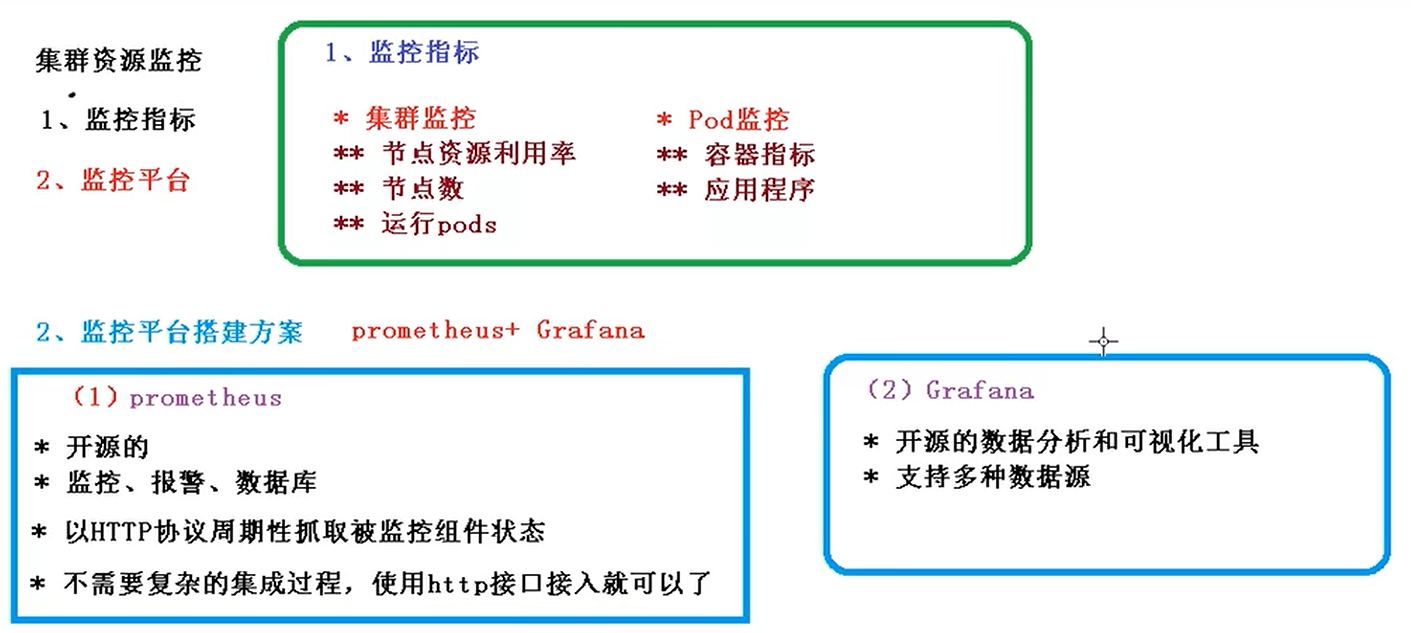
1.监控指标
-
集群监控
-
节点资源利用率(node1/2节点,每个节点cpu用了多少还剩多少)
-
节点数(3个在忙碌1个在空闲状态要考虑节点数的监控)
-
运行pods(1个节点运行了多少pod)
-
-
Pod监控
-
容器指标(pod中运行了多少容器)
-
应用程序(看到当前集群的完整情况)
-
2.监控平台搭建方案
prometheus + Grafana
(1)prometheus
-
开源的
-
监控、报警、数据库(把数据存储到自带的数据库中) (时间序列)
-
以HTTP协议周期性(每隔10分钟或15分钟)抓取被监控组件状态
-
不需要很复杂的集成过程,使用http接口接入就可以了
- 定时去搜索或抓取被监控组件状态的数据:当前哪些组件的利用率,他里面通过http协议进行系统监控:
- 通过http接口就可以接入监控系统,监控当前节点:比如1个master节点,2个node节点不需要做其他的开发
- 特别适合虚拟化环境:比如docker、虚拟机
(2) Grafana(组件)
这个组件主要做展现:比如通过prometheus抓取到很多状态的数据,然后通过一个页面展现出来,
-
-
支持多种数据源(mysql 、infuloDB)
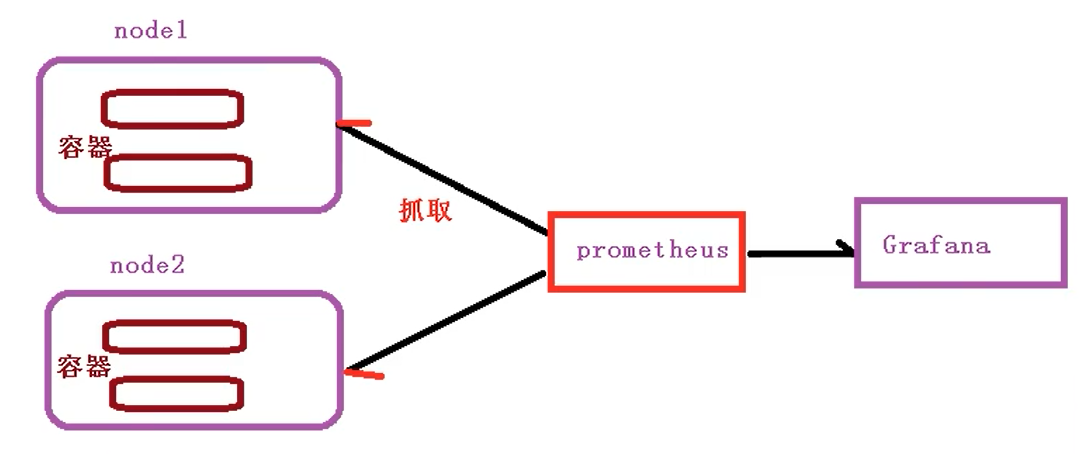
在集群运行环境中会产生各种数据:当前节点的cpu、节点数量、pod容器的相关指标;通过prometheus周期性的去抓取数据:进行存储:为最终做分析展现:Grafana读取prometheus里的数据:分析数据,通过可视化工具展现
55-Kubernetes集群资源监控-搭建监控平台
搭建监控平台
在Grafana里做一些设置让他指定prometheus里的数据源,指定显示的模板,最终通过里面的ip端口号进行访问
第一步部署 prometheus + Grafana
1、可以联网下载二进制的prometheus的安装包
2、用yaml文件直接部署
- configmay.yaml # 存储
- prometheus.deploy.yaml # 部署
- prometheus.svc.yml # 对外暴露端口
- rbac-setup.yaml # 权限
- node-exporter.yaml
- 先查看下这些yaml文件
# vim rbac-setup.yaml
# 为当前这个分配相应的角色包括他的权限,在集群内部默认是不能访问的需要给他分配一些角色,报一些权限
apiVersion: rbac.authorization.k8s.io/v1
kind: ClusterRole
metadata:
  name: prometheus
rules:
- apiGroups: [""]
  resources:
  - nodes
  - nodes/proxy
  - services
  - endpoints
  - pods
  verbs: ["get", "list", "watch"]  # 相关的权限
- apiGroups:
  - extensions
  resources:
  - ingresses
  verbs: ["get", "list", "watch"]
- nonResourceURLs: ["/metrics"]
  verbs: ["get"]
---
apiVersion: v1
kind: ServiceAccount  # 服务账号(用他进行访问)
metadata:
  name: prometheus
  namespace: kube-system
---
apiVersion: rbac.authorization.k8s.io/v1
kind: ClusterRoleBinding
metadata:
  name: prometheus
roleRef:
  apiGroup: rbac.authorization.k8s.io
  kind: ClusterRole
  name: prometheus
subjects:
- kind: ServiceAccount
  name: prometheus
  namespace: kube-system
# vim configmay.yaml
做一些配置文件相关的配置
apiVersion: v1
kind: ConfigMap  # 建一个configmap 不加密的用于一些配置文件
metadata:
  name: prometheus-config
  namespace: kube-system
data:
  prometheus.yml: |
    global:
      scrape_interval:     15s
      evaluation_interval: 15s
    scrape_configs:

    - job_name: 'kubernetes-apiservers'
      kubernetes_sd_configs:
      - role: endpoints
      scheme: https
      tls_config:
        ca_file: /var/run/secrets/kubernetes.io/serviceaccount/ca.crt
      bearer_token_file: /var/run/secrets/kubernetes.io/serviceaccount/token
      relabel_configs:
      - source_labels: [__meta_kubernetes_namespace, __meta_kubernetes_service_name, __meta_kubernetes_endpoint_port_name]
        action: keep
        regex: default;kubernetes;https

    - job_name: 'kubernetes-nodes'
      kubernetes_sd_configs:
      - role: node
      scheme: https
      tls_config:
        ca_file: /var/run/secrets/kubernetes.io/serviceaccount/ca.crt
      bearer_token_file: /var/run/secrets/kubernetes.io/serviceaccount/token
      relabel_configs:
      - action: labelmap
        regex: __meta_kubernetes_node_label_(.+)
      - target_label: __address__
        replacement: kubernetes.default.svc:443
      - source_labels: [__meta_kubernetes_node_name]
        regex: (.+)
        target_label: __metrics_path__
        replacement: /api/v1/nodes/${1}/proxy/metrics

    - job_name: 'kubernetes-cadvisor'
      kubernetes_sd_configs:
      - role: node
      scheme: https
      tls_config:
        ca_file: /var/run/secrets/kubernetes.io/serviceaccount/ca.crt
      bearer_token_file: /var/run/secrets/kubernetes.io/serviceaccount/token
      relabel_configs:
      - action: labelmap
        regex: __meta_kubernetes_node_label_(.+)
      - target_label: __address__
        replacement: kubernetes.default.svc:443
      - source_labels: [__meta_kubernetes_node_name]
        regex: (.+)
        target_label: __metrics_path__
        replacement: /api/v1/nodes/${1}/proxy/metrics/cadvisor

    - job_name: 'kubernetes-service-endpoints'
      kubernetes_sd_configs:
      - role: endpoints
      relabel_configs:
      - source_labels: [__meta_kubernetes_service_annotation_prometheus_io_scrape]
        action: keep
        regex: true
      - source_labels: [__meta_kubernetes_service_annotation_prometheus_io_scheme]
        action: replace
        target_label: __scheme__
        regex: (https?)
      - source_labels: [__meta_kubernetes_service_annotation_prometheus_io_path]
        action: replace
        target_label: __metrics_path__
        regex: (.+)
      - source_labels: [__address__, __meta_kubernetes_service_annotation_prometheus_io_port]
        action: replace
        target_label: __address__
        regex: ([^:]+)(?::\d+)?;(\d+)
        replacement: $1:$2
      - action: labelmap
        regex: __meta_kubernetes_service_label_(.+)
      - source_labels: [__meta_kubernetes_namespace]
        action: replace
        target_label: kubernetes_namespace
      - source_labels: [__meta_kubernetes_service_name]
        action: replace
        target_label: kubernetes_name

    - job_name: 'kubernetes-services'
      kubernetes_sd_configs:
      - role: service   # 与这个匹配
      metrics_path: /probe
      params:
        module: [http_2xx]
      relabel_configs:
      - source_labels: [__meta_kubernetes_service_annotation_prometheus_io_probe]
        action: keep
        regex: true
      - source_labels: [__address__]
        target_label: __param_target
      - target_label: __address__
        replacement: blackbox-exporter.example.com:9115
      - source_labels: [__param_target]
        target_label: instance
      - action: labelmap
        regex: __meta_kubernetes_service_label_(.+)
      - source_labels: [__meta_kubernetes_namespace]
        target_label: kubernetes_namespace
      - source_labels: [__meta_kubernetes_service_name]
        target_label: kubernetes_name

    - job_name: 'kubernetes-ingresses'
      kubernetes_sd_configs:
      - role: ingress
      relabel_configs:
      - source_labels: [__meta_kubernetes_ingress_annotation_prometheus_io_probe]
        action: keep
        regex: true
      - source_labels: [__meta_kubernetes_ingress_scheme,__address__,__meta_kubernetes_ingress_path]
        regex: (.+);(.+);(.+)
        replacement: ${1}://${2}${3}
        target_label: __param_target
      - target_label: __address__
        replacement: blackbox-exporter.example.com:9115
      - source_labels: [__param_target]
        target_label: instance
      - action: labelmap
        regex: __meta_kubernetes_ingress_label_(.+)
      - source_labels: [__meta_kubernetes_namespace]
        target_label: kubernetes_namespace
      - source_labels: [__meta_kubernetes_ingress_name]
        target_label: kubernetes_name

    - job_name: 'kubernetes-pods'
      kubernetes_sd_configs:
      - role: pod    #与当前集群中pod相关内容进行匹配
      relabel_configs:
      - source_labels: [__meta_kubernetes_pod_annotation_prometheus_io_scrape]
        action: keep
        regex: true
      - source_labels: [__meta_kubernetes_pod_annotation_prometheus_io_path]
        action: replace
        target_label: __metrics_path__
        regex: (.+)
      - source_labels: [__address__, __meta_kubernetes_pod_annotation_prometheus_io_port]
        action: replace
        regex: ([^:]+)(?::\d+)?;(\d+)  # 用正则表达式做一些相应内容的匹配
        replacement: $1:$2
        target_label: __address__
      - action: labelmap
        regex: __meta_kubernetes_pod_label_(.+)
      - source_labels: [__meta_kubernetes_namespace]
        action: replace
        target_label: kubernetes_namespace
      - source_labels: [__meta_kubernetes_pod_name]
        action: replace
        target_label: kubernetes_pod_name
# vim prometheus.deploy.yaml
---
apiVersion: apps/v1beta2
kind: Deployment  # 部署一个Deployment
metadata:
  labels:
    name: prometheus-deployment
  name: prometheus
  namespace: kube-system     # 把prometheus部署到名称空间是 kube-system 系统里面去
                             # 做当前节点的监控,放到 kube-system这个名称空间中
spec:
  replicas: 1
  selector:
    matchLabels:
      app: prometheus
  template:
    metadata:
      labels:
        app: prometheus
    spec:
      containers:
      - image: prom/prometheus:v2.0.0
        name: prometheus
        command:
        - "/bin/prometheus"
        args:
        - "--config.file=/etc/prometheus/prometheus.yml"
        - "--storage.tsdb.path=/prometheus"
        - "--storage.tsdb.retention=24h"
        ports:
        - containerPort: 9090
          protocol: TCP
        volumeMounts:
        - mountPath: "/prometheus"
          name: data
        - mountPath: "/etc/prometheus"
          name: config-volume
#-----------------------------------------------------
# 资源限制
        resources:
          requests:
            cpu: 100m
            memory: 100Mi
          limits:
            cpu: 500m
            memory: 2500Mi
#----------------------------------------------------
      serviceAccountName: prometheus
      volumes:     # 用数据卷做了一个数据挂载
      - name: data
        emptyDir: {}
      - name: config-volume
        configMap:
          name: prometheus-config
# vim prometheus.svc.yml
---
kind: Service
apiVersion: v1
metadata:
  labels:
    app: prometheus
  name: prometheus
  namespace: kube-system
spec:
  type: NodePort  # 对外暴露端口,做一个访问
  ports:
  - port: 9090
    targetPort: 9090
    nodePort: 30003
  selector:
    app: prometheus
# vim node-exporter.yaml-apiVersion: apps/v1
kind: DaemonSet  # 部署这么一个守护进程,我当中有很多的节点,每隔段时间其中的数据会不一样,监控也一直在执行,当前和后加入的节点都要执行监控
metadata:
  name: node-exporter
  namespace: kube-system
  labels:
    k8s-app: node-exporter
spec:
  selector:
    matchLabels:
      k8s-app: node-exporter
  template:
    metadata:
      labels:
        k8s-app: node-exporter
    spec:
      containers:
      - image: prom/node-exporter
        name: node-exporter
        ports:
        - containerPort: 9100
          protocol: TCP
          name: http
---
# service 对外暴露端口,用他进行访问
apiVersion: v1
kind: Service
metadata:
  labels:
    k8s-app: node-exporter
  name: node-exporter
  namespace: kube-system
spec:
  ports:
  - name: http
    port: 9100
    nodePort: 31672
    protocol: TCP
  type: NodePort
  selector:
    k8s-app: node-exporter
部署守护进程
[root@k8smaster ~]# mkdir pg
[root@k8smaster ~]# rm -rf pg
[root@k8smaster ~]# mkdir pgmonitor
[root@k8smaster ~]# cd pgmonitor
[root@k8smaster pgmonitor]# ls
grafana  node-exporter.yaml  prometheus
[root@k8smaster pgmonitor]# kubectl create -f node-exporter.yaml
service/node-exporter created
error: unable to recognize "node-exporter.yaml": no matches for kind "DaemonSet" in version "extensions/v1beta1"  # 版本不一样给他换一下,换成正式版

[root@k8smaster pgmonitor]# vim node-exporter.yaml

修改的地方   apiVersion: apps/v1

[root@k8smaster pgmonitor]# kubectl create -f node-exporter.yaml
error: error validating "node-exporter.yaml": error validating data: ValidationError(DaemonSet.spec): missing required field "selector" in io.k8s.api.apps.v1.DaemonSetSpec; if you choose to ignore these errors, turn validation off with --validate=false

# 文件中少了 selector   DaemonSetSpec中少了内容

[root@k8smaster pgmonitor]# vim node-exporter.yaml

修改的内容放在第一个spec:下面
spec:
  selector:
    matchLabels:
      k8s-app: node-exporter

[root@k8smaster pgmonitor]# kubectl create -f node-exporter.yaml
daemonset.apps/node-exporter created
The Service "node-exporter" is invalid: spec.ports[0].nodePort: Invalid value: 31672: provided port is already allocated # 有残留文件没删就是这状态

把之前测试时的文件删了

[root@k8smaster pgmonitor]# kubectl delete -f node-exporter.yaml
daemonset.apps "node-exporter" deleted
service "node-exporter" deleted

[root@k8smaster pgmonitor]# kubectl create -f node-exporter.yaml
daemonset.apps/node-exporter created
service/node-exporter created
部署其他yaml文件
部署rbac-setup.yaml
[root@master pgmonitor]# cd prometheus/
[root@master prometheus]# ls
configmap.yaml  prometheus.deploy.yml  prometheus.svc.yml  rbac-setup.yaml
[root@master prometheus]# kubectl create -f rbac-setup.yaml
clusterrole.rbac.authorization.k8s.io/prometheus created
serviceaccount/prometheus created
clusterrolebinding.rbac.authorization.k8s.io/prometheus created

部署 configmap.yaml

[root@master prometheus]# kubectl create -f configmap.yaml
configmap/prometheus-config created


[root@master prometheus]# kubectl create -f prometheus.deploy.yml
error: unable to recognize "prometheus.deploy.yml": no matches for kind "Deployment" in version "apps/v1beta2" # 报错标签问题给他改一下
[root@master prometheus]# vim prometheus.deploy.yml
改的地方:apiVersion: apps/v1
[root@k8smaster prometheus]# kubectl create -f prometheus.deploy.yml
deployment.apps/prometheus created
部署 prometheus.svc.yml
[root@master prometheus]# kubectl create -f prometheus.svc.yml service/prometheus created


[root@master prometheus]# kubectl get pods -n kube-system #查看,默认在kube-system中
NAME READY STATUS RESTARTS AGE
prometheus-7486bf7f4b-625gs 1/1 Running 0 3m35s
第二步部署 Grafana
先分别查看下这3个文件
grafana-deploy.yaml
apiVersion: apps/v1
kind: Deployment  # 部署一个Deployment应用
metadata:
  name: grafana-core
  namespace: kube-system
  labels:
    app: grafana
    component: core
spec:
  replicas: 1
  selector:
    matchLabels:
      selector:
    matchLabels:
      app: grafana
      component: core
  template:
    metadata:
      labels:
        app: grafana
        component: core
    spec:
      containers:
      - image: grafana/grafana:4.2.0
        name: grafana-core
        imagePullPolicy: IfNotPresent
        # env:
        resources:
          # keep request = limit to keep this container in guaranteed class
          limits:
            cpu: 100m
            memory: 100Mi
          requests:
            cpu: 100m
            memory: 100Mi
        env:
          # The following env variables set up basic auth twith the default admin user and admin password.
          - name: GF_AUTH_BASIC_ENABLED
            value: "true"
          - name: GF_AUTH_ANONYMOUS_ENABLED
            value: "false"
          # - name: GF_AUTH_ANONYMOUS_ORG_ROLE
          #   value: Admin
          # does not really work, because of template variables in exported dashboards:
          # - name: GF_DASHBOARDS_JSON_ENABLED
          #   value: "true"
        readinessProbe:
          httpGet:
            path: /login
            port: 3000
          # initialDelaySeconds: 30
          # timeoutSeconds: 1
        volumeMounts:
        - name: grafana-persistent-storage
          mountPath: /var
      volumes:
      - name: grafana-persistent-storage
        emptyDir: {}
grafana-svc.yaml
apiVersion: v1
kind: Service
metadata:
  name: grafana
  namespace: kube-system  都属于kube-system这个名称空间下
  labels:
    app: grafana
    component: core
spec:
  type: NodePort  # 暴露端口
  ports:
    - port: 3000
  selector:
    app: grafana
    component: core
grafana-ing.yaml
apiVersion: extensions/v1beta1
kind: Ingress
metadata:
   name: grafana
   namespace: kube-system
spec:
   rules:
   - host: k8s.grafana
     http:
       paths:
       - path: /
         backend:
          serviceName: grafana
          servicePort: 3000   # 对外暴露端口
[root@k8smaster prometheus]# cd ..
[root@master pgmonitor]# cd grafana/
[root@master grafana]# ls
grafana-deploy.yaml  grafana-ing.yaml  grafana-svc.yaml

[root@master grafana]# kubectl create -f grafana-deploy.yaml
error: unable to recognize "grafana-deploy.yaml": no matches for kind "Deployment" in version "extensions/v1beta1" # 需要修改标签
[root@master grafana]# vim grafana-deploy.yaml
改的地方:apiVersion: apps/v1
修改的内容放在第一个spec:下面
spec:
replicas: 1
selector:
matchLabels:
app: grafana
component: core
[root@k8smaster grafana]# kubectl create -f grafana-deploy.yaml
deployment.apps/grafana-core created
[root@master grafana]# kubectl create -f grafana-svc.yaml
service/grafana created

[root@master grafana]# kubectl create -f grafana-ing.yaml
ingress.extensions/grafana created

[root@master grafana]# kubectl get pods -n kube-system
NAME READY STATUS RESTARTS AGE
grafana-core-768b6bf79c-srmlt 1/1 Running 0 2m29s
prometheus-7486bf7f4b-625gs 1/1 Running 0 26m
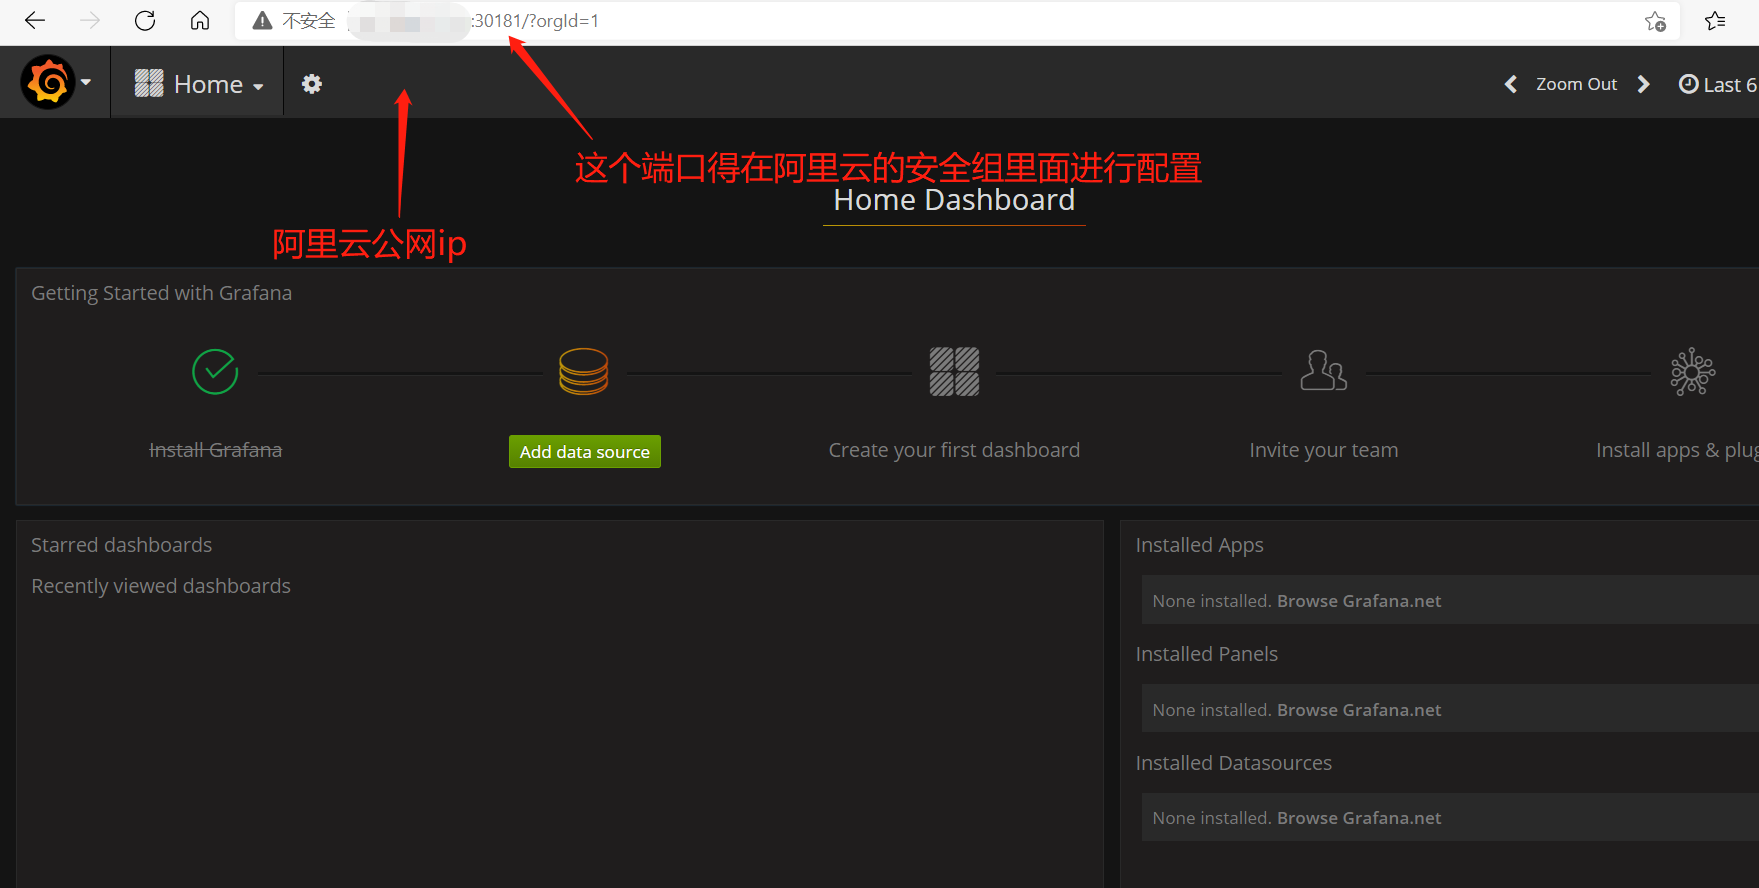
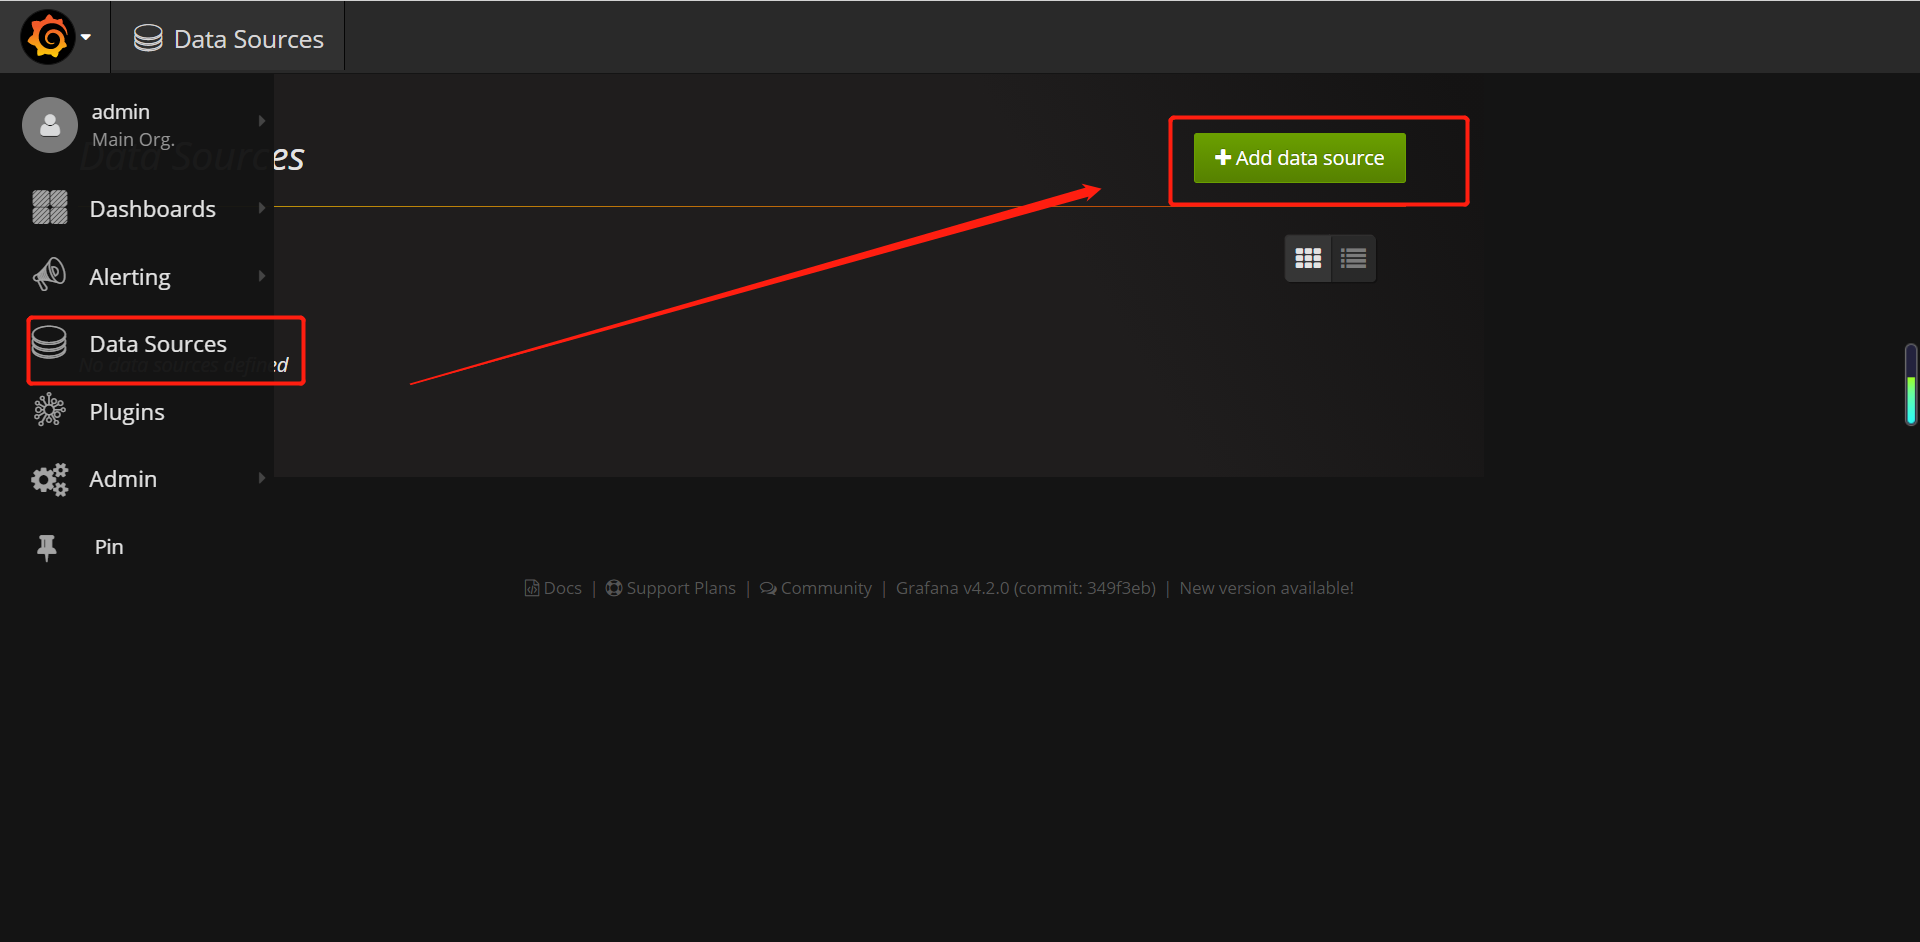
第三步 打开Granfana,配置数据源(就是prometheus),导入显示模板
查看下
[root@k8smaster grafana]# kubectl get svc -n kube-system
NAME TYPE CLUSTER-IP EXTERNAL-IP PORT(S) AGE
grafana NodePort 10.104.198.92 <none> 3000:31959/TCP 12h
prometheus NodePort 10.99.212.51 <none> 9090:30003/TCP 12h
详细查看
[root@master grafana]# kubectl get svc -n kube-system -o wide
NAME TYPE CLUSTER-IP EXTERNAL-IP PORT(S) AGE SELECTOR
grafana NodePort 10.104.198.92 <none> 3000:31959/TCP 12h app=grafana,component=core
prometheus NodePort 10.99.212.51 <none> 9090:30003/TCP 12h app=prometheus
通过查看端口号访问:
192.168.5.4:31959
默认的用户名和密码都是admin

配置数据源,使用prometheus

设置显示数据的模板 315固定的值

315固定值
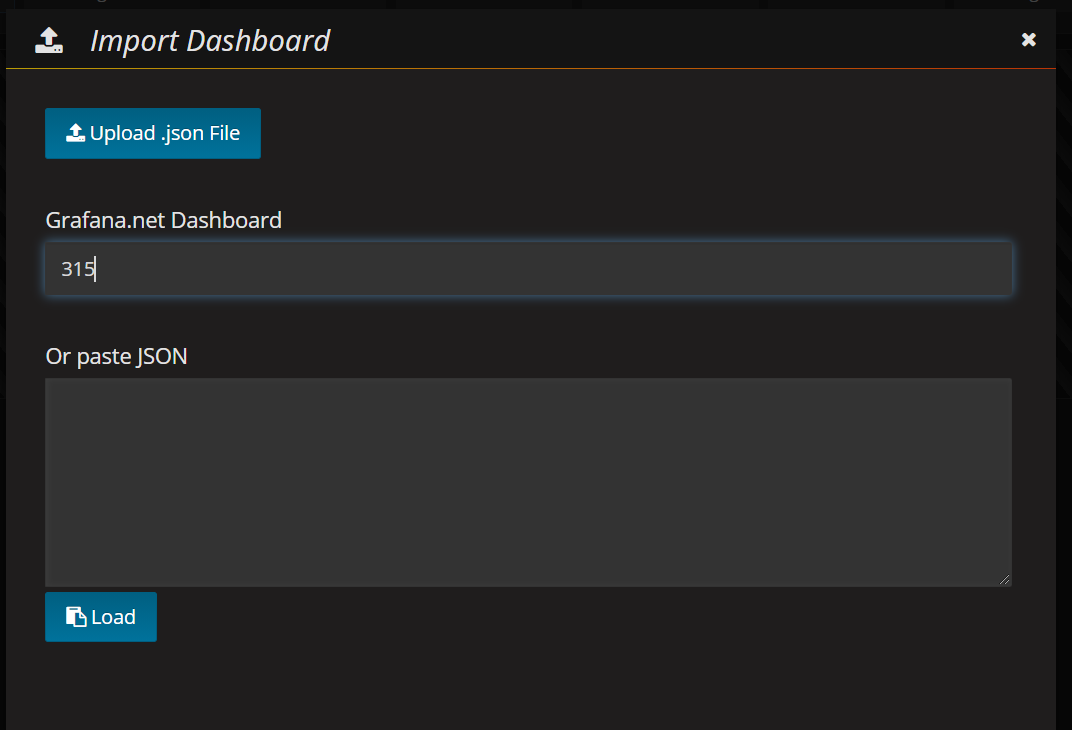
name可以自己改

选择当前数据源mydb

现在就能查看到监控数据了

删除yaml文件的命令(这两个命令都可以删除)
kubectl delete -f xxx.yaml

rm xxx.yaml
--------------------------------------------------------------------------------------------------------------------------------
以上单master集群的问题:如果master宕机了,再通过node节点就访问不到了,
至少要有两个master一个做备用,当某个节点挂掉了集群还是能正常使用做到高可用
56-Kubernetes集群搭建-搭建高可用集群(实现过程介绍)
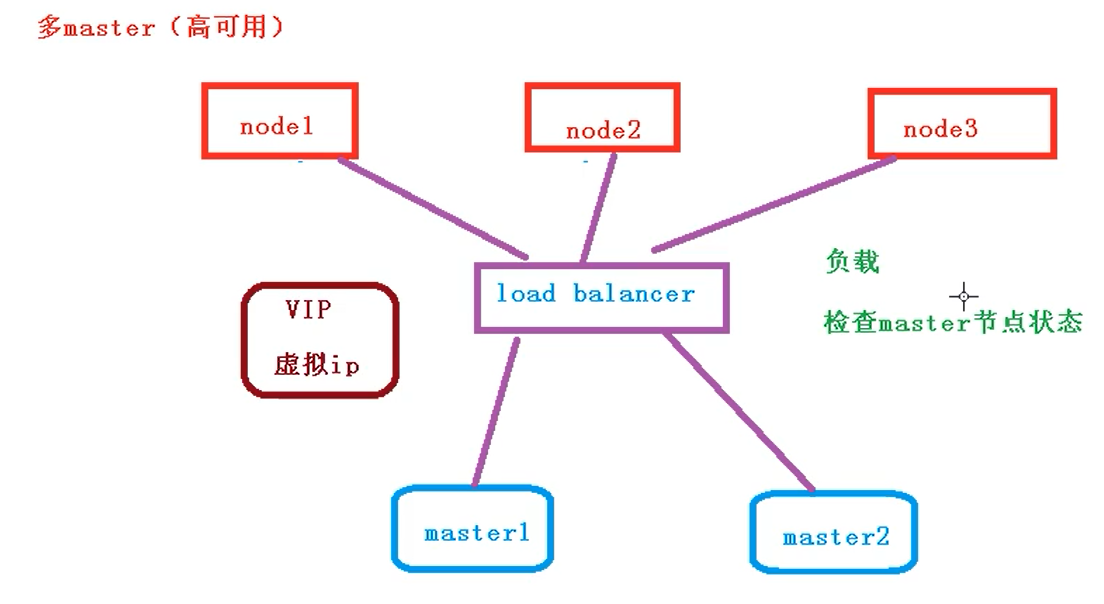
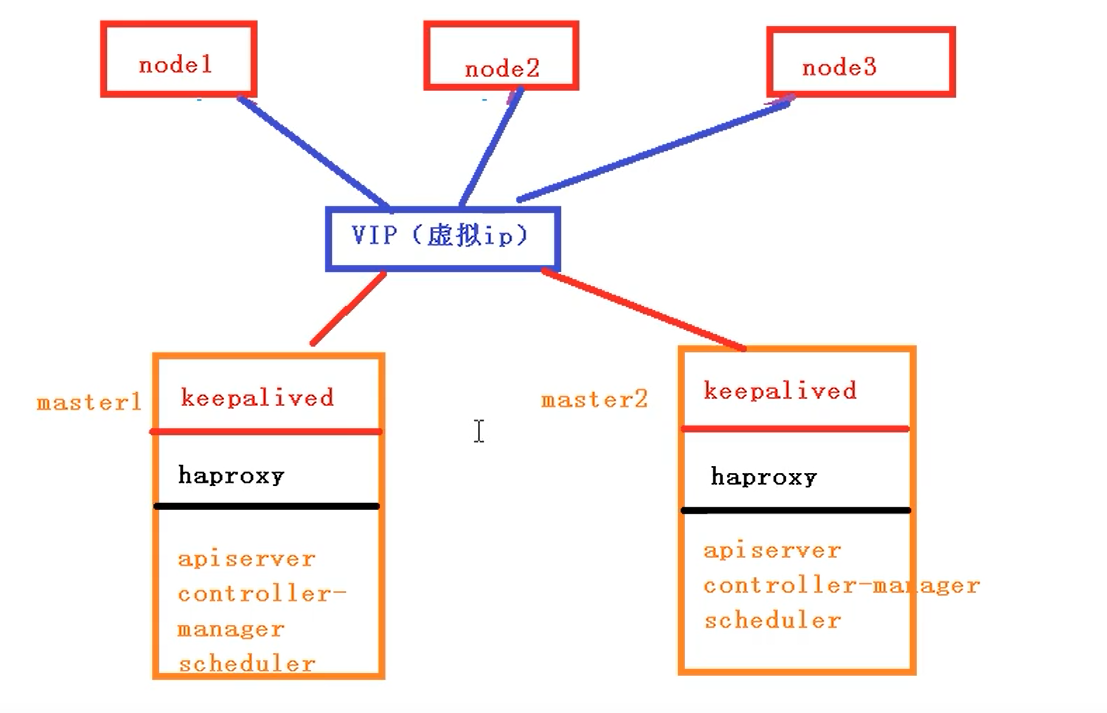
此虚拟ip不配置到具体的节点中,(不管连master1还是master2都先去访问这个虚拟ip) 他只是配置一个同网络ip,通过虚拟ip具体分发到master1/2中 load balancer(可以检查master的状态)
通过 load balancer检查节点的状态是否正常,这个过程中要用到keepalived,他可以检查master的状态和配置虚拟ip,下面就来做一个负载均衡的服务器
当不加haproxy直接使用keepalived的时候:虚拟ip要绑定某个节点,在节点中进行执行,当节点正常的时候这里面会有个问题,所有请求都会到这个vip所在的master节点上,他会飘到里面建立一个虚拟网卡(虚拟ip)
加上haproxy 后他会把我的请求平均分配到其他的master节点上,让其他master也加入到我这个请求中来,如果不加haproxy,他都是在当前虚拟ip所在节点中进行请求,把所有请求压力都给某一个节点,加上haproxy可以做到一个负载的效果
keepalived的两个作用
1、配置虚拟ip
2、检查master节点的状态
haproxy 还可以用nginx实现,过程相似 haproxy 下面是一些相关的组件
57-Kubernetes集群搭建-搭建高可用集群(初始化和部署keepalived)
master节点的操作
1.部署keepalived
2.部署haproxy
3.初始化操作
4.安装docker ,网络插件
node节点的操作
加入到集群中
安装docker
网络插件
# 关闭防火墙
systemctl stop firewalld
systemctl disable firewalld

# 关闭selinux
sed -i 's/enforcing/disabled/' /etc/selinux/config  # 永久
setenforce 0  # 临时

# 关闭swap
swapoff -a  # 临时
sed -ri 's/.*swap.*/#&/' /etc/fstab    # 永久

# 根据规划设置主机名
hostnamectl set-hostname <hostname>

# 在master添加hosts(这个在master1和master2里面都得创建)
cat >> /etc/hosts << EOF
192.168.44.158    master.k8s.io   k8s-vip
阿里云公网ip   master01.k8s.io master1
阿里云公网ip   master02.k8s.io master2
阿里云公网ip    node01.k8s.io   node1
EOF

# 将桥接的IPv4流量传递到iptables的链
cat > /etc/sysctl.d/k8s.conf << EOF
net.bridge.bridge-nf-call-ip6tables = 1
net.bridge.bridge-nf-call-iptables = 1
EOF
sysctl --system  # 生效

# 时间同步
yum install ntpdate -y
ntpdate time.windows.com
所有master节点部署keepalived
安装相关包和keepalived
yum install -y conntrack-tools libseccomp libtool-ltdl

yum install -y keepalived
配置master节点
master1节点配置
cat > /etc/keepalived/keepalived.conf <<EOF
! Configuration File for keepalived

global_defs {
   router_id k8s
}

vrrp_script check_haproxy {
    script "killall -0 haproxy"
    interval 3
    weight -2
    fall 10
    rise 2
}

vrrp_instance VI_1 {
    state MASTER
    interface eth0
    virtual_router_id 51
    priority 250
    advert_int 1
    authentication {
        auth_type PASS
        auth_pass ceb1b3ec013d66163d6ab
    }
    virtual_ipaddress {
        47.108.237.230
    }
    track_script {
        check_haproxy
    }

}
EOF
master2节点配置
cat > /etc/keepalived/keepalived.conf <<EOF
! Configuration File for keepalived

global_defs {
   router_id k8s
}

vrrp_script check_haproxy {
    script "killall -0 haproxy"
    interval 3
    weight -2
    fall 10
    rise 2
}

vrrp_instance VI_1 {
    state BACKUP
    interface eth0
    virtual_router_id 51
    priority 200
    advert_int 1
    authentication {
        auth_type PASS
        auth_pass ceb1b3ec013d66163d6ab
    }
    virtual_ipaddress {
        47.108.237.230
    }
    track_script {
        check_haproxy
    }

}
EOF
启动和检查
在两台master节点都执行
# 启动keepalived
$ systemctl start keepalived.service
设置开机启动
$ systemctl enable keepalived.service
# 查看启动状态
$ systemctl status keepalived.service
启动后查看master1的网卡信息
ip a s ens33
这是节点1的操作,节点1和节点2是相同的操作
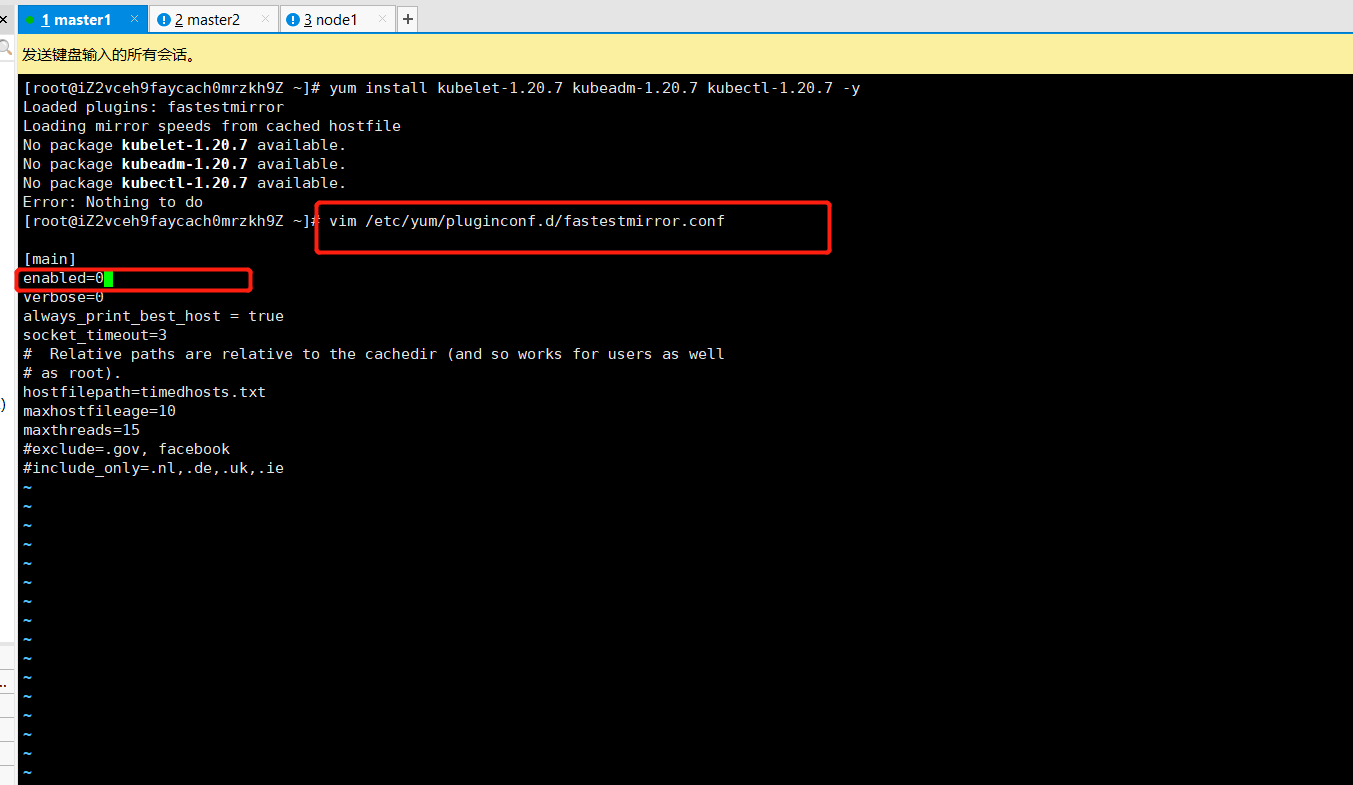
[root@iZ2vceh9faycach0mrzkh9Z ~]# systemctl stop firewalld
[root@iZ2vceh9faycach0mrzkh9Z ~]# systemctl disable firewalld
[root@iZ2vceh9faycach0mrzkh9Z ~]# sed -i 's/enforcing/disabled/' /etc/selinux/config
[root@iZ2vceh9faycach0mrzkh9Z ~]# setenforce 0
setenforce: SELinux is disabled
[root@iZ2vceh9faycach0mrzkh9Z ~]# swapoff -a
[root@iZ2vceh9faycach0mrzkh9Z ~]# sed -ri 's/.*swap.*/#&/' /etc/fstab
[root@iZ2vceh9faycach0mrzkh9Z ~]# hostnamectl set-hostname master1
[root@iZ2vceh9faycach0mrzkh9Z ~]# hostname
master1
[root@iZ2vceh9faycach0mrzkh9Z ~]# cat >> /etc/hosts << EOF
> 47.108.237.230 master.k8s.io k8s-vip
> 阿里云公网ip master01.k8s.io master1
> 阿里云公网ip  master02.k8s.io master2
> 阿里云公网ip node01.k8s.io node1
> EOF
[root@iZ2vceh9faycach0mrzkh9Z ~]# cat > /etc/sysctl.d/k8s.conf << EOF
> net.bridge.bridge-nf-call-ip6tables = 1
> net.bridge.bridge-nf-call-iptables = 1
> EOF
[root@iZ2vceh9faycach0mrzkh9Z ~]#  sysctl --system
[root@iZ2vceh9faycach0mrzkh9Z ~]#  yum install ntpdate -y
[root@iZ2vceh9faycach0mrzkh9Z ~]# ntpdate time.windows.com
13 Jun 19:03:12 ntpdate[1578]: adjust time server 20.189.79.72 offset -0.006970 sec
[root@iZ2vceh9faycach0mrzkh9Z ~]# yum install -y conntrack-tools libseccomp libtool-ltdl

Complete!
[root@iZ2vceh9faycach0mrzkh9Z ~]# yum install -y keepalived
[root@iZ2vceh9faycach0mrzkh9Z ~]# ifconfig #查看网卡
eth0: flags=4163<UP,BROADCAST,RUNNING,MULTICAST>  mtu 1500
        inet 172.31.197.185  netmask 255.255.240.0  broadcast 172.31.207.255
        inet6 fe80::216:3eff:fe03:4ff8  prefixlen 64  scopeid 0x20<link>
        ether 00:16:3e:03:4f:f8  txqueuelen 1000  (Ethernet)
        RX packets 70543  bytes 103055816 (98.2 MiB)
        RX errors 0  dropped 0  overruns 0  frame 0
        TX packets 7790  bytes 1040858 (1016.4 KiB)
        TX errors 0  dropped 0 overruns 0  carrier 0  collisions 0

lo: flags=73<UP,LOOPBACK,RUNNING>  mtu 65536
        inet 127.0.0.1  netmask 255.0.0.0
        inet6 ::1  prefixlen 128  scopeid 0x10<host>
        loop  txqueuelen 1000  (Local Loopback)
        RX packets 0  bytes 0 (0.0 B)
        RX errors 0  dropped 0  overruns 0  frame 0
        TX packets 0  bytes 0 (0.0 B)
        TX errors 0  dropped 0 overruns 0  carrier 0  collisions 0

[root@iZ2vceh9faycach0mrzkh9Z ~]# cat > /etc/keepalived/keepalived.conf <<EOF
> ! Configuration File for keepalived
>
> global_defs {
>    router_id k8s
> }
>
> vrrp_script check_haproxy {
>     script "killall -0 haproxy"
>     interval 3
>     weight -2
>     fall 10
>     rise 2
> }
>
> vrrp_instance VI_1 {
>     state MASTER
>     interface eth0
>     virtual_router_id 51
>     priority 250
>     advert_int 1
>     authentication {
>         auth_type PASS
>         auth_pass ceb1b3ec013d66163d6ab
>     }
>     virtual_ipaddress {
>         47.108.237.230
>     }
>     track_script {
>         check_haproxy
>     }
>
> }
> EOF
[root@iZ2vceh9faycach0mrzkh9Z ~]# systemctl start keepalived.service
[root@iZ2vceh9faycach0mrzkh9Z ~]#  systemctl enable keepalived.service
Created symlink from /etc/systemd/system/multi-user.target.wants/keepalived.service to /usr/lib/systemd/system/keepalived.service.
[root@iZ2vceh9faycach0mrzkh9Z ~]# systemctl status keepalived.service
[root@iZ2vceh9faycach0mrzkh9Z ~]# ip a s eth0
2: eth0: <BROADCAST,MULTICAST,UP,LOWER_UP> mtu 1500 qdisc pfifo_fast state UP group default qlen 1000
    link/ether 00:16:3e:03:4f:f8 brd ff:ff:ff:ff:ff:ff
    inet 172.31.197.185/20 brd 172.31.207.255 scope global dynamic eth0
       valid_lft 315357692sec preferred_lft 315357692sec
    inet 47.108.237.230/32 scope global eth0
       valid_lft forever preferred_lft forever
    inet6 fe80::216:3eff:fe03:4ff8/64 scope link
       valid_lft forever preferred_lft forever
[root@iZ2vceh9faycach0mrzkh9Z ~]#
部署haproxy
安装
yum install -y haproxy
配置
两台master节点的配置均相同,配置中声明了后端代理的两个master节点服务器,指定了haproxy运行的端口为16443等,因此16443端口为集群的入口
cat > /etc/haproxy/haproxy.cfg << EOF
#---------------------------------------------------------------------
# Global settings
#---------------------------------------------------------------------
global
    # to have these messages end up in /var/log/haproxy.log you will
    # need to:
    # 1) configure syslog to accept network log events.  This is done
    #    by adding the '-r' option to the SYSLOGD_OPTIONS in
    #    /etc/sysconfig/syslog
    # 2) configure local2 events to go to the /var/log/haproxy.log
    #   file. A line like the following can be added to
    #   /etc/sysconfig/syslog
    #
    #    local2.*                       /var/log/haproxy.log
    #
    log         127.0.0.1 local2

    chroot      /var/lib/haproxy
    pidfile     /var/run/haproxy.pid
    maxconn     4000
    user        haproxy
    group       haproxy
    daemon

    # turn on stats unix socket
    stats socket /var/lib/haproxy/stats
#---------------------------------------------------------------------
# common defaults that all the 'listen' and 'backend' sections will
# use if not designated in their block
#---------------------------------------------------------------------
defaults
    mode                    http
    log                     global
    option                  httplog
    option                  dontlognull
    option http-server-close
    option forwardfor       except 127.0.0.0/8
    option                  redispatch
    retries                 3
    timeout http-request    10s
    timeout queue           1m
    timeout connect         10s
    timeout client          1m
    timeout server          1m
    timeout http-keep-alive 10s
    timeout check           10s
    maxconn                 3000
#---------------------------------------------------------------------
# kubernetes apiserver frontend which proxys to the backends
#---------------------------------------------------------------------
frontend kubernetes-apiserver
    mode                 tcp
    bind                 *:16443
    option               tcplog
    default_backend      kubernetes-apiserver
#---------------------------------------------------------------------
# round robin balancing between the various backends
#---------------------------------------------------------------------
backend kubernetes-apiserver
    mode        tcp
    balance     roundrobin
    server      master01.k8s.io   47.109.29.143:6443 check
    server      master02.k8s.io   47.109.22.78:6443 check
#---------------------------------------------------------------------
# collection haproxy statistics message
#---------------------------------------------------------------------
listen stats
    bind                 *:1080
    stats auth           admin:awesomePassword
    stats refresh        5s
    stats realm          HAProxy\ Statistics
    stats uri            /admin?stats
EOF
启动和检查
两台master都启动
# 设置开机启动
$ systemctl enable haproxy
# 开启haproxy
$ systemctl start haproxy
# 查看启动状态
$ systemctl status haproxy
检查端口
netstat -lntup|grep haproxy
两台master节点都要的操作
[root@iZ2vc96g79oqyzqf8xj5l3Z ~]# yum install -y haproxy
[root@iZ2vc96g79oqyzqf8xj5l3Z ~]# cat > /etc/haproxy/haproxy.cfg << EOF
> #---------------------------------------------------------------------
> # Global settings
> #---------------------------------------------------------------------
> global
>     # to have these messages end up in /var/log/haproxy.log you will
>     # need to:
>     # 1) configure syslog to accept network log events.  This is done
>     #    by adding the '-r' option to the SYSLOGD_OPTIONS in
>     #    /etc/sysconfig/syslog
>     # 2) configure local2 events to go to the /var/log/haproxy.log
>     #   file. A line like the following can be added to
>     #   /etc/sysconfig/syslog
>     #
>     #    local2.*                       /var/log/haproxy.log
>     #
>     log         127.0.0.1 local2
>
>     chroot      /var/lib/haproxy
>     pidfile     /var/run/haproxy.pid
>     maxconn     4000
>     user        haproxy
>     group       haproxy
>     daemon
>
>     # turn on stats unix socket
>     stats socket /var/lib/haproxy/stats
> #---------------------------------------------------------------------
> # common defaults that all the 'listen' and 'backend' sections will
> # use if not designated in their block
> #---------------------------------------------------------------------
> defaults
>     mode                    http
>     log                     global
>     option                  httplog
>     option                  dontlognull
>     option http-server-close
>     option forwardfor       except 127.0.0.0/8
>     option                  redispatch
>     retries                 3
>     timeout http-request    10s
>     timeout queue           1m
>     timeout connect         10s
>     timeout client          1m
>     timeout server          1m
>     timeout http-keep-alive 10s
>     timeout check           10s
>     maxconn                 3000
> #---------------------------------------------------------------------
> # kubernetes apiserver frontend which proxys to the backends
> #---------------------------------------------------------------------
> frontend kubernetes-apiserver
>     mode                 tcp
>     bind                 *:16443
>     option               tcplog
>     default_backend      kubernetes-apiserver
> #---------------------------------------------------------------------
> # round robin balancing between the various backends
> #---------------------------------------------------------------------
> backend kubernetes-apiserver
>     mode        tcp
>     balance     roundrobin
>     server      master01.k8s.io   47.109.31.67:6443 check
>     server      master02.k8s.io   47.109.23.137:6443 check
> #---------------------------------------------------------------------
> # collection haproxy statistics message
> #---------------------------------------------------------------------
> listen stats
>     bind                 *:1080
>     stats auth           admin:awesomePassword
>     stats refresh        5s
>     stats realm          HAProxy\ Statistics
>     stats uri            /admin?stats
> EOF
[root@iZ2vc96g79oqyzqf8xj5l3Z ~]# systemctl enable haproxy
Created symlink from /etc/systemd/system/multi-user.target.wants/haproxy.service to /usr/lib/systemd/system/haproxy.service.
[root@iZ2vc96g79oqyzqf8xj5l3Z ~]# systemctl start haproxy
[root@iZ2vc96g79oqyzqf8xj5l3Z ~]# systemctl status haproxy
● haproxy.service - HAProxy Load Balancer
   Loaded: loaded (/usr/lib/systemd/system/haproxy.service; enabled; vendor preset: disabled)
   Active: active (running) since Sun 2021-06-13 21:20:33 CST; 8s ago
 Main PID: 2449 (haproxy-systemd)
   CGroup: /system.slice/haproxy.service
           ├─2449 /usr/sbin/haproxy-systemd-wrapper -f /etc/haproxy/haproxy.cfg -p /run/haproxy.pid
           ├─2450 /usr/sbin/haproxy -f /etc/haproxy/haproxy.cfg -p /run/haproxy.pid -Ds
           └─2451 /usr/sbin/haproxy -f /etc/haproxy/haproxy.cfg -p /run/haproxy.pid -Ds

Jun 13 21:20:33 master1 systemd[1]: Started HAProxy Load Balancer.
Jun 13 21:20:33 master1 haproxy-systemd-wrapper[2449]: haproxy-systemd-wrapper: executing /usr/sbin/haproxy -f /etc/haproxy/haproxy.cfg -p /run/h
Jun 13 21:20:33 master1 haproxy-systemd-wrapper[2449]: [WARNING] 163/212033 (2450) : config : 'option forwardfor' ignored for frontend 'kubernete
Jun 13 21:20:33 master1 haproxy-systemd-wrapper[2449]: [WARNING] 163/212033 (2450) : config : 'option forwardfor' ignored for backend 'kubernetes
[root@iZ2vc96g79oqyzqf8xj5l3Z ~]# netstat -lntup|grep haproxy
tcp        0      0 0.0.0.0:1080            0.0.0.0:*               LISTEN      2451/haproxy
tcp        0      0 0.0.0.0:16443           0.0.0.0:*               LISTEN      2451/haproxy
udp        0      0 0.0.0.0:47890           0.0.0.0:*                           2450/haproxy
所有节点安装Docker/kubeadm/kubelet
Kubernetes默认CRI(容器运行时)为Docker,因此先安装Docker。
安装Docker
#yum安装gcc相关环境(需要确保虚拟机可以上外网)
yum -y install gcc
yum -y install gcc-c++

#1.卸载旧的版本
 yum remove docker \
                  docker-client \
                  docker-client-latest \
                  docker-common \
                  docker-latest \
                  docker-latest-logrotate \
                  docker-logrotate \
                  docker-engine
  # 2.需要的安装包
  yum install -y yum-utils
  # 3.设置镜像的仓库
  yum-config-manager \
    --add-repo \
    https://download.docker.com/linux/centos/docker-ce.repo

 # 建议安装阿里云
  yum-config-manager \
    --add-repo \
    http://mirrors.aliyun.com/docker-ce/linux/centos/docker-ce.repo
#4更新yum软件包索引
 yum makecache fast


# 5安装docker相关的内容   docker-ce 社区   ee企业版
 yum install -y docker-ce docker-ce-cli containerd.io
 #6 启动docker
 systemctl start docker
 #7.使用 docker version 查看是否安装成功


# 8 配置镜像加速器
sudo mkdir -p /etc/docker
sudo tee /etc/docker/daemon.json <<-'EOF'
{
  "registry-mirrors": ["https://g6yrjrwf.mirror.aliyuncs.com"]
}
EOF
sudo systemctl daemon-reload
sudo systemctl restart docker

#docker info
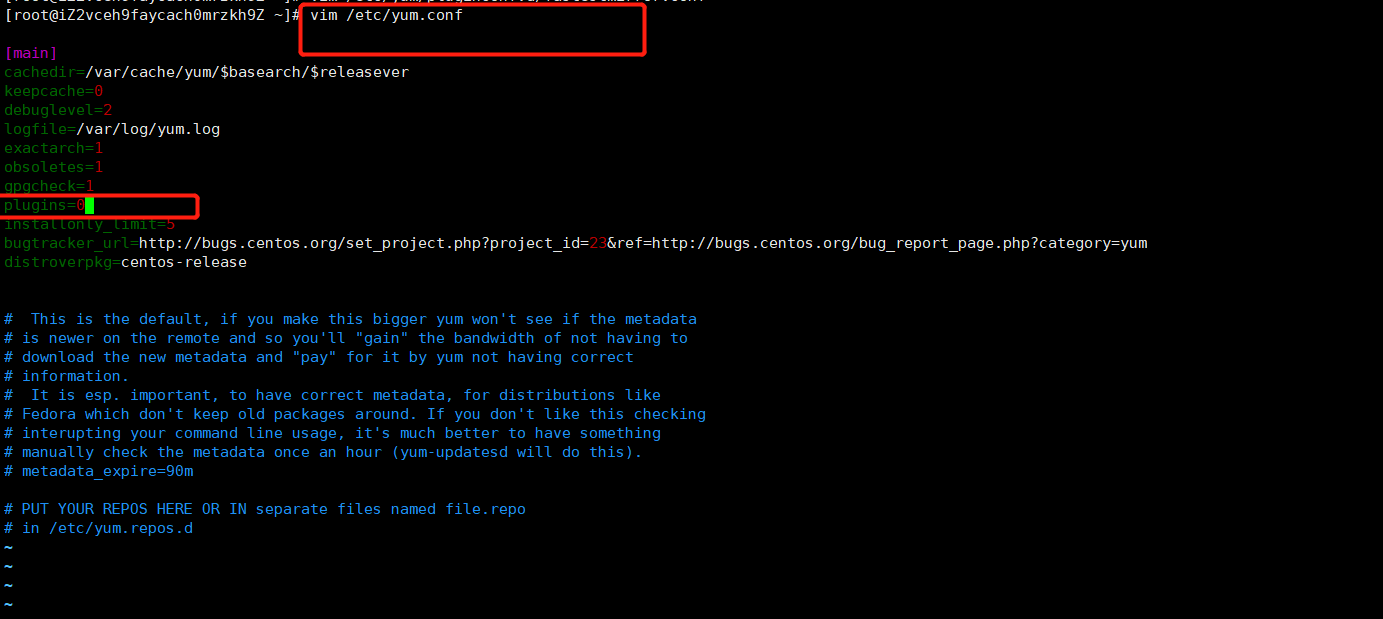
添加阿里云YUM软件源
$ cat > /etc/yum.repos.d/kubernetes.repo << EOF
[kubernetes]
name=Kubernetes
baseurl=https://mirrors.aliyun.com/kubernetes/yum/repos/kubernetes-el7-x86_64
enabled=1
gpgcheck=0
repo_gpgcheck=0
gpgkey=https://mirrors.aliyun.com/kubernetes/yum/doc/yum-key.gpg https://mirrors.aliyun.com/kubernetes/yum/doc/rpm-package-key.gpg
EOF
安装kubeadm,kubelet和kubectl
由于版本更新频繁,这里指定版本号部署:
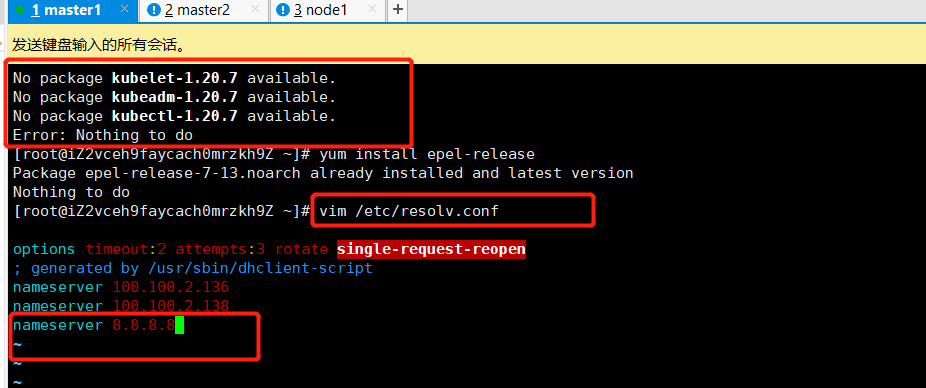
$  yum install kubelet-1.20.7 kubeadm-1.20.7 kubectl-1.20.7 -y
$ systemctl enable kubelet

master1 master2 node1节点都要有的操作
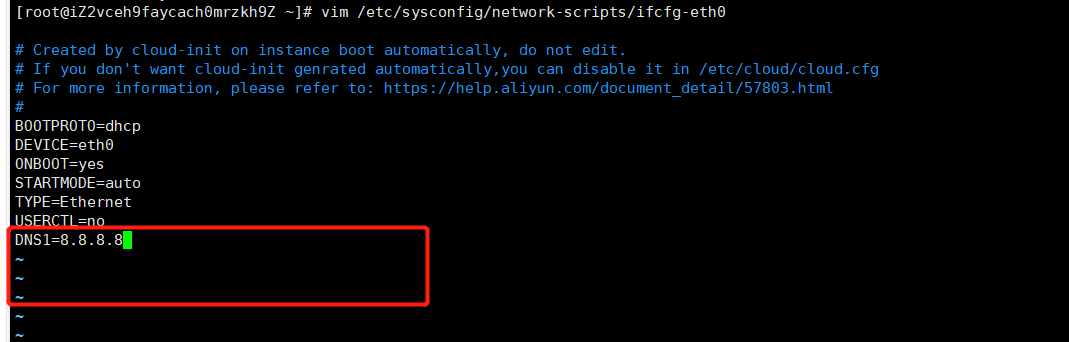
[root@iZ2vc96g79oqyzqf8xj5l3Z ~]# yum -y install gcc
[root@iZ2vc96g79oqyzqf8xj5l3Z ~]# yum -y install gcc-c++
[root@iZ2vc96g79oqyzqf8xj5l3Z ~]#  yum remove docker \
>                   docker-client \
>                   docker-client-latest \
>                   docker-common \
>                   docker-latest \
>                   docker-latest-logrotate \
>                   docker-logrotate \
>                   docker-engine
[root@iZ2vc96g79oqyzqf8xj5l3Z ~]#  yum install -y yum-utils
[root@iZ2vc96g79oqyzqf8xj5l3Z ~]# yum-config-manager \
>     --add-repo \
>     http://mirrors.aliyun.com/docker-ce/linux/centos/docker-ce.repo
Loaded plugins: fastestmirror
adding repo from: http://mirrors.aliyun.com/docker-ce/linux/centos/docker-ce.repo
grabbing file http://mirrors.aliyun.com/docker-ce/linux/centos/docker-ce.repo to /etc/yum.repos.d/docker-ce.repo
repo saved to /etc/yum.repos.d/docker-ce.repo
[root@iZ2vc96g79oqyzqf8xj5l3Z ~]# yum makecache fast
Loaded plugins: fastestmirror
Loading mirror speeds from cached hostfile
base
docker-ce-stable
epel
extras
updates
(1/2): docker-ce-stable/7/x86_64/updateinfo
(2/2): docker-ce-stable/7/x86_64/primary_db
Metadata Cache Created
[root@iZ2vc96g79oqyzqf8xj5l3Z ~]#  yum install -y docker-ce docker-ce-cli containerd.io
[root@iZ2vc96g79oqyzqf8xj5l3Z ~]#  systemctl start docker
[root@iZ2vc96g79oqyzqf8xj5l3Z ~]# sudo mkdir -p /etc/docker
[root@iZ2vc96g79oqyzqf8xj5l3Z ~]# sudo tee /etc/docker/daemon.json <<-'EOF'
> {
>   "registry-mirrors": ["https://g6yrjrwf.mirror.aliyuncs.com"]
> }
> EOF
{
  "registry-mirrors": ["https://g6yrjrwf.mirror.aliyuncs.com"]
}
[root@iZ2vc96g79oqyzqf8xj5l3Z ~]# sudo systemctl daemon-reload
[root@iZ2vc96g79oqyzqf8xj5l3Z ~]# sudo systemctl restart docker
[root@iZ2vc96g79oqyzqf8xj5l3Z ~]# $ cat > /etc/yum.repos.d/kubernetes.repo << EOF
> [kubernetes]
> name=Kubernetes
> baseurl=https://mirrors.aliyun.com/kubernetes/yum/repos/kubernetes-el7-x86_64
> enabled=1
> gpgcheck=0
> repo_gpgcheck=0
> gpgkey=https://mirrors.aliyun.com/kubernetes/yum/doc/yum-key.gpg https://mirrors.aliyun.com/kubernetes/yum/doc/rpm-package-key.gpg
> EOF
-bash: $: command not found
[root@iZ2vc96g79oqyzqf8xj5l3Z ~]# vim  /etc/docker/daemon.json
[root@iZ2vc96g79oqyzqf8xj5l3Z ~]#  cat > /etc/yum.repos.d/kubernetes.repo << EOF
> [kubernetes]
> name=Kubernetes
> baseurl=https://mirrors.aliyun.com/kubernetes/yum/repos/kubernetes-el7-x86_64
> enabled=1
> gpgcheck=0
> repo_gpgcheck=0
> gpgkey=https://mirrors.aliyun.com/kubernetes/yum/doc/yum-key.gpg https://mirrors.aliyun.com/kubernetes/yum/doc/rpm-package-key.gpg
> EOF
[root@iZ2vc96g79oqyzqf8xj5l3Z ~]# yum install kubelet-1.20.7 kubeadm-1.20.7 kubectl-1.20.7 -y
部署Kubernetes Master
创建kubeadm配置文件
在具有vip的master上操作,这里为master2(我的这里是master2)
ip a s eth0 #通过这个命令查看具体在哪个master节点上操作
$ mkdir /usr/local/kubernetes/manifests -p

$ cd /usr/local/kubernetes/manifests/

$ vi kubeadm-config.yaml

apiServer:
  certSANs:
    - master1
    - master2
    - master.k8s.io
    - 47.109.20.140
    - 47.109.31.67
    - 47.109.23.137
    - 127.0.0.1
  extraArgs:
    authorization-mode: Node,RBAC
  timeoutForControlPlane: 4m0s
apiVersion: kubeadm.k8s.io/v1beta2
certificatesDir: /etc/kubernetes/pki
clusterName: kubernetes
controlPlaneEndpoint: "master.k8s.io:16443"
controllerManager: {}
dns:
  type: CoreDNS
etcd:
  local:
    dataDir: /var/lib/etcd
imageRepository: registry.aliyuncs.com/google_containers
kind: ClusterConfiguration
kubernetesVersion: v1.20.7
networking:
  dnsDomain: cluster.local
  podSubnet: 10.244.0.0/16
  serviceSubnet: 10.1.0.0/16
scheduler: {}
在master2节点执行
$ kubeadm init --config kubeadm-config.yaml
遇到的错误:
W0613 21:46:45.433570   15099 common.go:77] your configuration file uses a deprecated API spec: "kubeadm.k8s.io/v1beta1". Please use 'kubeadm config migrate --old-config old.yaml --new-config new.yaml', which will write the new, similar spec using a newer API version.
this version of kubeadm only supports deploying clusters with the control plane version >= 1.19.0. Current version: v1.16.3
To see the stack trace of this error execute with --v=5 or higher
解决办法修改kubeadm-config.yaml文件:
apiVersion: kubeadm.k8s.io/v1beta2
kubernetesVersion: v1.20.7  #这个修改与自己下载的版本一致
如果遇到改了很多文件,然后越改越错的情况,则使用这个命令kubeadm reset,然后把下面的操作重新执行一次,大多数时候是能成功的
[root@master2 ~]# cd /etc/kubernetes/manifests
[root@master2 manifests]# ls
etcd.yaml  kube-apiserver.yaml  kube-controller-manager.yaml  kube-scheduler.yaml
[root@master2 manifests]# vim kube-controller-manager.yaml
[root@master2 manifests]# vim kube-scheduler.yaml
[root@master2 manifests]# kubectl get cs
[root@master2 manifests]# kubectl get pods -n kube-system
NAME                              READY   STATUS    RESTARTS   AGE
coredns-7f89b7bc75-bpj72          1/1     Running   0          10h
coredns-7f89b7bc75-z62hl          1/1     Running   0          10h
etcd-master2                      1/1     Running   0          10h
kube-apiserver-master2            1/1     Running   0          10h
kube-controller-manager-master2   1/1     Running   0          2m10s
kube-flannel-ds-xxmlj             1/1     Running   0          10h
kube-proxy-7f5h8                  1/1     Running   0          10h
kube-scheduler-master2            0/1     Running   0          50s
[root@master2 manifests]# kubectl get pods -n kube-system
NAME                              READY   STATUS    RESTARTS   AGE
coredns-7f89b7bc75-bpj72          1/1     Running   0          10h
coredns-7f89b7bc75-z62hl          1/1     Running   0          10h
etcd-master2                      1/1     Running   0          10h
kube-apiserver-master2            1/1     Running   0          10h
kube-controller-manager-master2   1/1     Running   0          2m33s
kube-flannel-ds-xxmlj             1/1     Running   0          10h
kube-proxy-7f5h8                  1/1     Running   0          10h
kube-scheduler-master2            1/1     Running   0          73s
[root@master2 manifests]# mkdir flannel
[root@master2 manifests]# cd flannel
[root@master2 flannel]# wget -c https://raw.githubusercontent.com/coreos/flannel/master/Documentation/kube-flannel.yml
[root@master2 flannel]# kubectl apply -f kube-flannel.yml
[root@master2 flannel]# ssh root@47.109.31.67 mkdir -p /etc/kubernetes/pki/etcd
root@47.109.31.67's password:
[root@master2 flannel]# scp /etc/kubernetes/admin.conf root@47.109.31.67:/etc/kubernetes
root@47.109.31.67's password:
admin.conf                                                                                                                                                    100% 5566    10.9MB/s   00:00
[root@master2 flannel]# scp /etc/kubernetes/pki/{ca.*,sa.*,front-proxy-ca.*} root@47.109.31.67:/etc/kubernetes/pki
root@47.109.31.67's password:
ca.crt                                                                                                                                                        100% 1066     2.1MB/s   00:00
ca.key                                                                                                                                                        100% 1675     3.5MB/s   00:00
sa.key                                                                                                                                                        100% 1679     3.6MB/s   00:00
sa.pub                                                                                                                                                        100%  451     1.2MB/s   00:00
front-proxy-ca.crt                                                                                                                                            100% 1078     2.4MB/s   00:00
front-proxy-ca.key                                                                                                                                            100% 1679     3.8MB/s   00:00
[root@master2 flannel]# scp /etc/kubernetes/pki/etcd/ca.* root@47.109.31.67:/etc/kubernetes/pki/etcd
root@47.109.31.67's password:
ca.crt                                                                                                                                                        100% 1058     2.1MB/s   00:00
ca.key
[root@master2 flannel]#  mkdir /usr/local/kubernetes/manifests -p
[root@master2 flannel]# cd /usr/local/kubernetes/manifests/
[root@master2 manifests]# vim kubeadm-config.yaml
[root@master2 manifests]# kubeadm init --config kubeadm-config.yaml
[init] Using Kubernetes version: v1.20.7
[preflight] Running pre-flight checks
    [WARNING IsDockerSystemdCheck]: detected "cgroupfs" as the Docker cgroup driver. The recommended driver is "systemd". Please follow the guide at https://kubernetes.io/docs/setup/cri/
    [WARNING SystemVerification]: this Docker version is not on the list of validated versions: 20.10.7. Latest validated version: 19.03
[preflight] Pulling images required for setting up a Kubernetes cluster
[preflight] This might take a minute or two, depending on the speed of your internet connection
[preflight] You can also perform this action in beforehand using 'kubeadm config images pull'
[certs] Using certificateDir folder "/etc/kubernetes/pki"
[certs] Generating "ca" certificate and key
[certs] Generating "apiserver" certificate and key
[certs] apiserver serving cert is signed for DNS names [kubernetes kubernetes.default kubernetes.default.svc kubernetes.default.svc.cluster.local master.k8s.io master1 master2] and IPs [10.1.0.1 172.31.197.188 47.109.20.140 47.109.31.67 47.109.23.137 127.0.0.1]
[certs] Generating "apiserver-kubelet-client" certificate and key
[certs] Generating "front-proxy-ca" certificate and key
[certs] Generating "front-proxy-client" certificate and key
[certs] Generating "etcd/ca" certificate and key
[certs] Generating "etcd/server" certificate and key
[certs] etcd/server serving cert is signed for DNS names [localhost master2] and IPs [172.31.197.188 127.0.0.1 ::1]
[certs] Generating "etcd/peer" certificate and key
[certs] etcd/peer serving cert is signed for DNS names [localhost master2] and IPs [172.31.197.188 127.0.0.1 ::1]
[certs] Generating "etcd/healthcheck-client" certificate and key
[certs] Generating "apiserver-etcd-client" certificate and key
[certs] Generating "sa" key and public key
[kubeconfig] Using kubeconfig folder "/etc/kubernetes"
[endpoint] WARNING: port specified in controlPlaneEndpoint overrides bindPort in the controlplane address
[kubeconfig] Writing "admin.conf" kubeconfig file
[endpoint] WARNING: port specified in controlPlaneEndpoint overrides bindPort in the controlplane address
[kubeconfig] Writing "kubelet.conf" kubeconfig file
[endpoint] WARNING: port specified in controlPlaneEndpoint overrides bindPort in the controlplane address
[kubeconfig] Writing "controller-manager.conf" kubeconfig file
[endpoint] WARNING: port specified in controlPlaneEndpoint overrides bindPort in the controlplane address
[kubeconfig] Writing "scheduler.conf" kubeconfig file
[kubelet-start] Writing kubelet environment file with flags to file "/var/lib/kubelet/kubeadm-flags.env"
[kubelet-start] Writing kubelet configuration to file "/var/lib/kubelet/config.yaml"
[kubelet-start] Starting the kubelet
[control-plane] Using manifest folder "/etc/kubernetes/manifests"
[control-plane] Creating static Pod manifest for "kube-apiserver"
[control-plane] Creating static Pod manifest for "kube-controller-manager"
[control-plane] Creating static Pod manifest for "kube-scheduler"
[etcd] Creating static Pod manifest for local etcd in "/etc/kubernetes/manifests"
[wait-control-plane] Waiting for the kubelet to boot up the control plane as static Pods from directory "/etc/kubernetes/manifests". This can take up to 4m0s
[apiclient] All control plane components are healthy after 12.007521 seconds
[upload-config] Storing the configuration used in ConfigMap "kubeadm-config" in the "kube-system" Namespace
[kubelet] Creating a ConfigMap "kubelet-config-1.20" in namespace kube-system with the configuration for the kubelets in the cluster
[upload-certs] Skipping phase. Please see --upload-certs
[mark-control-plane] Marking the node master2 as control-plane by adding the labels "node-role.kubernetes.io/master=''" and "node-role.kubernetes.io/control-plane='' (deprecated)"
[mark-control-plane] Marking the node master2 as control-plane by adding the taints [node-role.kubernetes.io/master:NoSchedule]
[bootstrap-token] Using token: rijbv2.50zq7e6zkpixxcg4
[bootstrap-token] Configuring bootstrap tokens, cluster-info ConfigMap, RBAC Roles
[bootstrap-token] configured RBAC rules to allow Node Bootstrap tokens to get nodes
[bootstrap-token] configured RBAC rules to allow Node Bootstrap tokens to post CSRs in order for nodes to get long term certificate credentials
[bootstrap-token] configured RBAC rules to allow the csrapprover controller automatically approve CSRs from a Node Bootstrap Token
[bootstrap-token] configured RBAC rules to allow certificate rotation for all node client certificates in the cluster
[bootstrap-token] Creating the "cluster-info" ConfigMap in the "kube-public" namespace
[kubelet-finalize] Updating "/etc/kubernetes/kubelet.conf" to point to a rotatable kubelet client certificate and key
[addons] Applied essential addon: CoreDNS
[endpoint] WARNING: port specified in controlPlaneEndpoint overrides bindPort in the controlplane address
[addons] Applied essential addon: kube-proxy

Your Kubernetes control-plane has initialized successfully!

To start using your cluster, you need to run the following as a regular user:

  mkdir -p $HOME/.kube
  sudo cp -i /etc/kubernetes/admin.conf $HOME/.kube/config
  sudo chown $(id -u):$(id -g) $HOME/.kube/config

Alternatively, if you are the root user, you can run:

  export KUBECONFIG=/etc/kubernetes/admin.conf

You should now deploy a pod network to the cluster.
Run "kubectl apply -f [podnetwork].yaml" with one of the options listed at:
  https://kubernetes.io/docs/concepts/cluster-administration/addons/

You can now join any number of control-plane nodes by copying certificate authorities
and service account keys on each node and then running the following as root:

  kubeadm join master.k8s.io:16443 --token rijbv2.50zq7e6zkpixxcg4 \
    --discovery-token-ca-cert-hash sha256:7b34954f4a26987b9e56da871607a694581120142ae2814c313f50e9c77efc9d \
    --control-plane

Then you can join any number of worker nodes by running the following on each as root:

kubeadm join master.k8s.io:16443 --token rijbv2.50zq7e6zkpixxcg4 \
    --discovery-token-ca-cert-hash sha256:7b34954f4a26987b9e56da871607a694581120142ae2814c313f50e9c77efc9d
[root@master2 manifests]#
按照提示配置环境变量,使用kubectl工具:
mkdir -p $HOME/.kube
sudo cp -i /etc/kubernetes/admin.conf $HOME/.kube/config
sudo chown $(id -u):$(id -g) $HOME/.kube/config
$ kubectl get nodes
$ kubectl get pods -n kube-system
按照提示保存以下内容,一会要使用:
  kubeadm join master.k8s.io:16443 --token txwxys.lpyfg7ze218akqtw \
    --discovery-token-ca-cert-hash sha256:f2275499d9e26a7ce76745138dfa10fdfc336cf1bee22314c26989fe6deb4372 \
    --control-plane
查看集群状态
kubectl get cs

kubectl get pods -n kube-system
遇到的问题:
scheduler            Unhealthy   Get "http://127.0.0.1:10251/healthz": dial tcp 127.0.0.1:10251: connect: connection refused
controller-manager   Unhealthy   Get "http://127.0.0.1:10252/healthz": dial tcp 127.0.0.1:10252: connect: connection refused
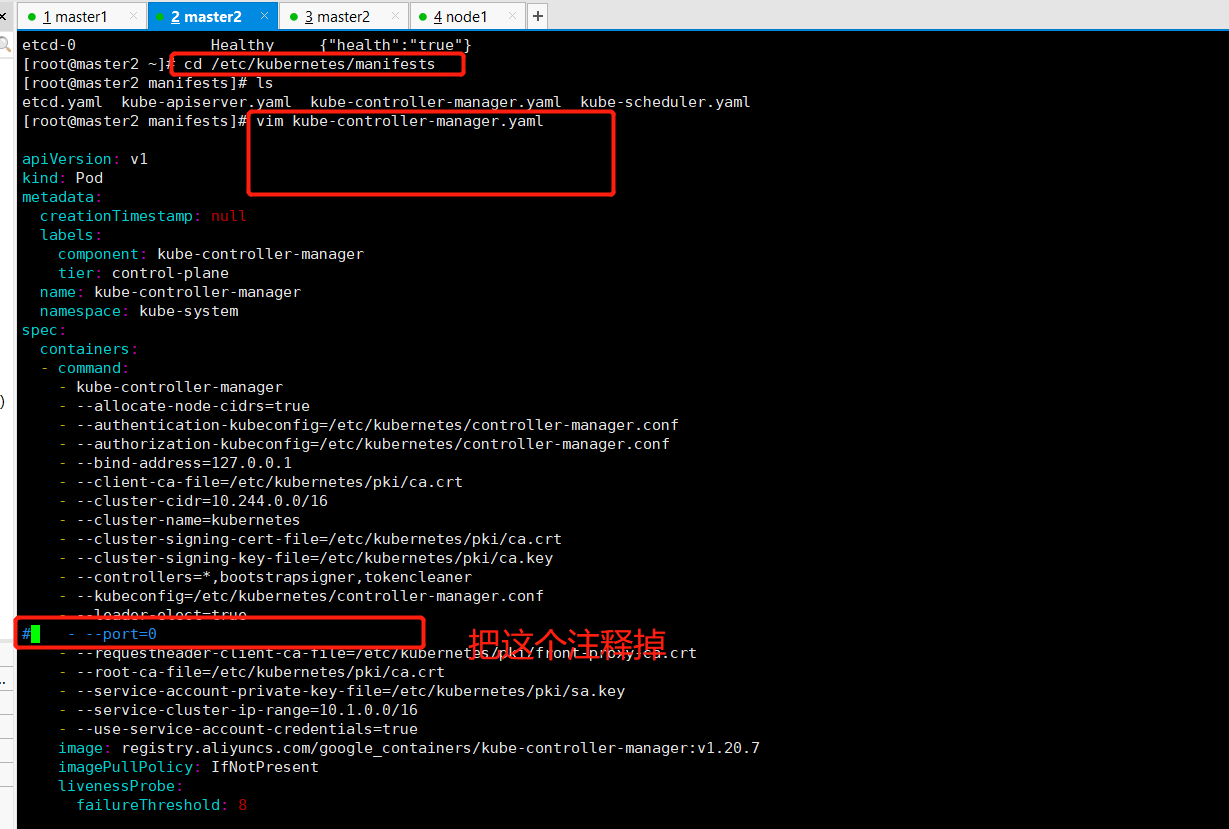
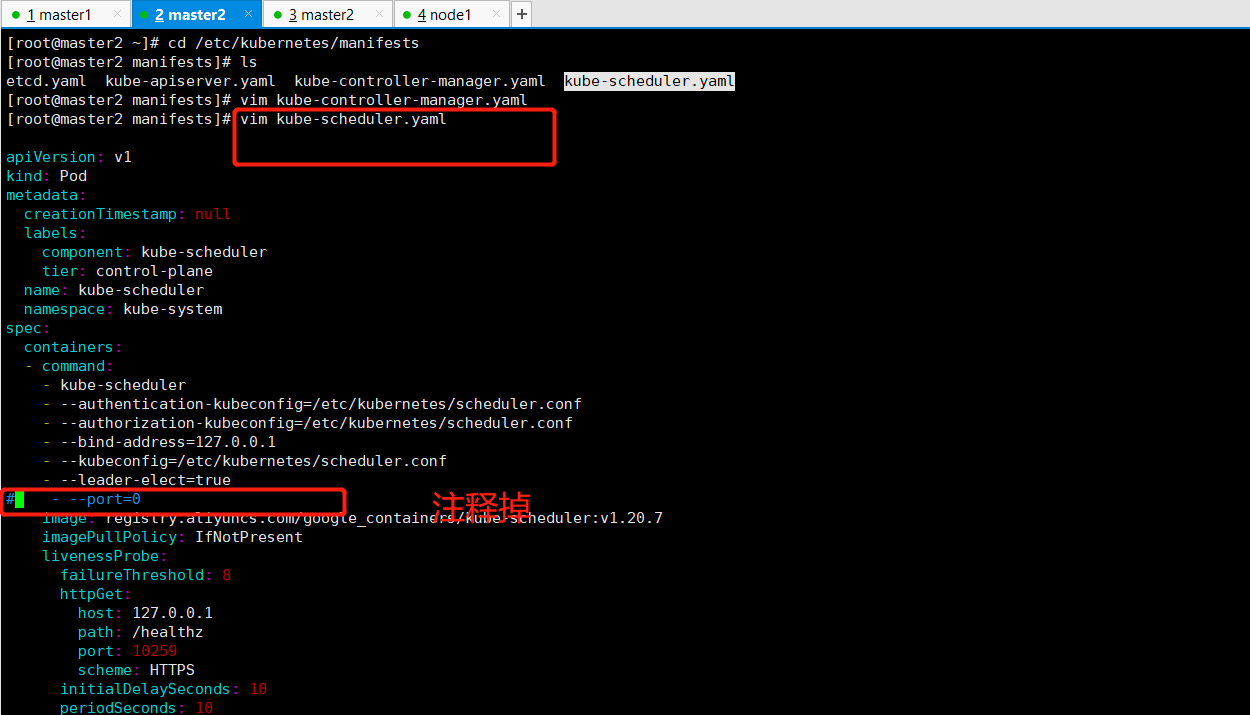
注释掉后的结果
[root@master2 manifests]# kubectl get cs
Warning: v1 ComponentStatus is deprecated in v1.19+
NAME                 STATUS      MESSAGE                                                                                       ERROR
scheduler            Unhealthy   Get "http://127.0.0.1:10251/healthz": dial tcp 127.0.0.1:10251: connect: connection refused
controller-manager   Healthy     ok
etcd-0               Healthy     {"health":"true"}
[root@master2 manifests]# kubectl get cs
Warning: v1 ComponentStatus is deprecated in v1.19+
NAME                 STATUS    MESSAGE             ERROR
scheduler            Healthy   ok
controller-manager   Healthy   ok
etcd-0               Healthy   {"health":"true"}
安装集群网络
从官方地址获取到flannel的yaml,在master1上执行
mkdir flannel
cd flannel
wget -c https://raw.githubusercontent.com/coreos/flannel/master/Documentation/kube-flannel.yml
安装flannel网络
kubectl apply -f kube-flannel.yml
检查
kubectl get pods -n kube-system
[root@master2 manifests]# mkdir flannel
[root@master2 manifests]# cd flannel
[root@master2 flannel]# wget -c https://raw.githubusercontent.com/coreos/flannel/master/Documentation/kube-flannel.yml
--2021-06-14 09:55:17--  https://raw.githubusercontent.com/coreos/flannel/master/Documentation/kube-flannel.yml
Resolving raw.githubusercontent.com (raw.githubusercontent.com)... 185.199.110.133, 185.199.111.133, 185.199.108.133, ...
Connecting to raw.githubusercontent.com (raw.githubusercontent.com)|185.199.110.133|:443... connected.
HTTP request sent, awaiting response... 200 OK
Length: 4813 (4.7K) [text/plain]
Saving to: ‘kube-flannel.yml’

100%[======================================================================================================================================================>] 4,813       8.77KB/s   in 0.5s

2021-06-14 09:55:18 (8.77 KB/s) - ‘kube-flannel.yml’ saved [4813/4813]

[root@master2 flannel]# kubectl apply -f kube-flannel.yml
podsecuritypolicy.policy/psp.flannel.unprivileged created
clusterrole.rbac.authorization.k8s.io/flannel created
clusterrolebinding.rbac.authorization.k8s.io/flannel created
serviceaccount/flannel created
configmap/kube-flannel-cfg created
daemonset.apps/kube-flannel-ds created
[root@master2 flannel]# kubectl get pods -n kube-system
master1节点加入集群
复制密钥及相关文件
从master1复制密钥及相关文件到master2
# ssh root@47.109.31.67 mkdir -p /etc/kubernetes/pki/etcd

# scp /etc/kubernetes/admin.conf root@47.109.31.67:/etc/kubernetes

# scp /etc/kubernetes/pki/{ca.*,sa.*,front-proxy-ca.*} root@47.109.31.67:/etc/kubernetes/pki

# scp /etc/kubernetes/pki/etcd/ca.* root@47.109.31.67:/etc/kubernetes/pki/etcd
[root@master2 flannel]# ssh root@47.109.31.67 mkdir -p /etc/kubernetes/pki/etcd
root@47.109.31.67's password:
[root@master2 flannel]# scp /etc/kubernetes/admin.conf root@47.109.31.67:/etc/kubernetes
root@47.109.31.67's password:
admin.conf                                                                                                                                                    100% 5570     8.7MB/s   00:00
[root@master2 flannel]# scp /etc/kubernetes/pki/{ca.*,sa.*,front-proxy-ca.*} root@47.109.31.67:/etc/kubernetes/pki
root@47.109.31.67's password:
ca.crt                                                                                                                                                        100% 1066     2.2MB/s   00:00
ca.key                                                                                                                                                        100% 1675     3.6MB/s   00:00
sa.key                                                                                                                                                        100% 1675     3.7MB/s   00:00
sa.pub                                                                                                                                                        100%  451     1.1MB/s   00:00
front-proxy-ca.crt                                                                                                                                            100% 1078     2.6MB/s   00:00
front-proxy-ca.key                                                                                                                                            100% 1675     4.1MB/s   00:00
[root@master2 flannel]# scp /etc/kubernetes/pki/etcd/ca.* root@47.109.31.67:/etc/kubernetes/pki/etcd
root@47.109.31.67's password:
ca.crt                                                                                                                                                        100% 1058     2.3MB/s   00:00
ca.key
master1节点join遇到的错误
[root@master1 kubernetes]# kubeadm join master.k8s.io:16443 --token rijbv2.50zq7e6zkpixxcg4     --discovery-token-ca-cert-hash sha256:7b34954f4a26987b9e56da871607a694581120142ae2814c313f50e9c77efc9d     --control-plane
[preflight] Running pre-flight checks
    [WARNING IsDockerSystemdCheck]: detected "cgroupfs" as the Docker cgroup driver. The recommended driver is "systemd". Please follow the guide at https://kubernetes.io/docs/setup/cri/
    [WARNING SystemVerification]: this Docker version is not on the list of validated versions: 20.10.7. Latest validated version: 19.03
error execution phase preflight: [preflight] Some fatal errors occurred:
    [ERROR DirAvailable--etc-kubernetes-manifests]: /etc/kubernetes/manifests is not empty
[preflight] If you know what you are doing, you can make a check non-fatal with `--ignore-preflight-errors=...`
To see the stack trace of this error execute with --v=5 or higher
[kubelet-start] Writing kubelet configuration to file "/var/lib/kubelet/config.yaml"
error execution phase kubelet-start: failed to create directory "/var/lib/kubelet": mkdir /var/lib/kubelet: not a directory
解决办法:
[root@master1 kubernetes]# rm -f /var/lib/kubelet   # 删除
#找到错误的原因,然后修改,之后重启进行相关操作
[root@master1 kubernetes]# kubeadm reset # 这个是重启
#重启之后要在master2节点上重新执行下面这些语句,
# ssh root@47.109.31.67 mkdir -p /etc/kubernetes/pki/etcd

# scp /etc/kubernetes/admin.conf root@47.109.31.67:/etc/kubernetes

# scp /etc/kubernetes/pki/{ca.*,sa.*,front-proxy-ca.*} root@47.109.31.67:/etc/kubernetes/pki

# scp /etc/kubernetes/pki/etcd/ca.* root@47.109.31.67:/etc/kubernetes/pki/etcd
执行成功:
[root@master1 kubernetes]# kubeadm join master.k8s.io:16443 --token rijbv2.50zq7e6zkpixxcg4     --discovery-token-ca-cert-hash sha256:7b34954f4a26987b9e56da871607a694581120142ae2814c313f50e9c77efc9d     --control-plane
[preflight] Running pre-flight checks
    [WARNING IsDockerSystemdCheck]: detected "cgroupfs" as the Docker cgroup driver. The recommended driver is "systemd". Please follow the guide at https://kubernetes.io/docs/setup/cri/
    [WARNING SystemVerification]: this Docker version is not on the list of validated versions: 20.10.7. Latest validated version: 19.03
[preflight] Reading configuration from the cluster...
[preflight] FYI: You can look at this config file with 'kubectl -n kube-system get cm kubeadm-config -o yaml'
[preflight] Running pre-flight checks before initializing the new control plane instance
[preflight] Pulling images required for setting up a Kubernetes cluster
[preflight] This might take a minute or two, depending on the speed of your internet connection
[preflight] You can also perform this action in beforehand using 'kubeadm config images pull'
[certs] Using certificateDir folder "/etc/kubernetes/pki"
[certs] Generating "etcd/server" certificate and key
[certs] etcd/server serving cert is signed for DNS names [localhost master1] and IPs [172.31.197.187 127.0.0.1 ::1]
[certs] Generating "etcd/peer" certificate and key
[certs] etcd/peer serving cert is signed for DNS names [localhost master1] and IPs [172.31.197.187 127.0.0.1 ::1]
[certs] Generating "etcd/healthcheck-client" certificate and key
[certs] Generating "apiserver-etcd-client" certificate and key
[certs] Generating "apiserver" certificate and key
[certs] apiserver serving cert is signed for DNS names [kubernetes kubernetes.default kubernetes.default.svc kubernetes.default.svc.cluster.local master.k8s.io master1 master2] and IPs [10.1.0.1 172.31.197.187 47.109.20.140 47.109.31.67 47.109.23.137 127.0.0.1]
[certs] Generating "apiserver-kubelet-client" certificate and key
[certs] Generating "front-proxy-client" certificate and key
[certs] Valid certificates and keys now exist in "/etc/kubernetes/pki"
[certs] Using the existing "sa" key
[kubeconfig] Generating kubeconfig files
[kubeconfig] Using kubeconfig folder "/etc/kubernetes"
[endpoint] WARNING: port specified in controlPlaneEndpoint overrides bindPort in the controlplane address
[kubeconfig] Using existing kubeconfig file: "/etc/kubernetes/admin.conf"
[endpoint] WARNING: port specified in controlPlaneEndpoint overrides bindPort in the controlplane address
[kubeconfig] Writing "controller-manager.conf" kubeconfig file
[endpoint] WARNING: port specified in controlPlaneEndpoint overrides bindPort in the controlplane address
[kubeconfig] Writing "scheduler.conf" kubeconfig file
[control-plane] Using manifest folder "/etc/kubernetes/manifests"
[control-plane] Creating static Pod manifest for "kube-apiserver"
[control-plane] Creating static Pod manifest for "kube-controller-manager"
[control-plane] Creating static Pod manifest for "kube-scheduler"
[check-etcd] Checking that the etcd cluster is healthy
[kubelet-start] Writing kubelet configuration to file "/var/lib/kubelet/config.yaml"
[kubelet-start] Writing kubelet environment file with flags to file "/var/lib/kubelet/kubeadm-flags.env"
[kubelet-start] Starting the kubelet
[kubelet-start] Waiting for the kubelet to perform the TLS Bootstrap...
[etcd] Announced new etcd member joining to the existing etcd cluster
[etcd] Creating static Pod manifest for "etcd"
[etcd] Waiting for the new etcd member to join the cluster. This can take up to 40s
[upload-config] Storing the configuration used in ConfigMap "kubeadm-config" in the "kube-system" Namespace
[mark-control-plane] Marking the node master1 as control-plane by adding the labels "node-role.kubernetes.io/master=''" and "node-role.kubernetes.io/control-plane='' (deprecated)"
[mark-control-plane] Marking the node master1 as control-plane by adding the taints [node-role.kubernetes.io/master:NoSchedule]

This node has joined the cluster and a new control plane instance was created:

* Certificate signing request was sent to apiserver and approval was received.
* The Kubelet was informed of the new secure connection details.
* Control plane (master) label and taint were applied to the new node.
* The Kubernetes control plane instances scaled up.
* A new etcd member was added to the local/stacked etcd cluster.

To start administering your cluster from this node, you need to run the following as a regular user:

    mkdir -p $HOME/.kube
    sudo cp -i /etc/kubernetes/admin.conf $HOME/.kube/config
    sudo chown $(id -u):$(id -g) $HOME/.kube/config

Run 'kubectl get nodes' to see this node join the cluster.

[root@master1 kubernetes]# mkdir -p $HOME/.kube
[root@master1 kubernetes]# sudo cp -i /etc/kubernetes/admin.conf $HOME/.kube/config
[root@master1 kubernetes]# sudo chown $(id -u):$(id -g) $HOME/.kube/config
在master2节点上查看:
[root@master2 flannel]# kubectl get nodes
NAME      STATUS   ROLES                  AGE   VERSION
master1   Ready    control-plane,master   10m   v1.20.7
master2   Ready    control-plane,master   79m   v1.20.7
[root@master2 flannel]# kubectl get pods --all-namespaces
NAMESPACE     NAME                              READY   STATUS    RESTARTS   AGE
kube-system   coredns-7f89b7bc75-qcwzx          1/1     Running   0          79m
kube-system   coredns-7f89b7bc75-w2x25          1/1     Running   0          79m
kube-system   etcd-master1                      1/1     Running   0          11m
kube-system   etcd-master2                      1/1     Running   0          79m
kube-system   kube-apiserver-master1            1/1     Running   0          11m
kube-system   kube-apiserver-master2            1/1     Running   0          79m
kube-system   kube-controller-manager-master1   1/1     Running   0          11m
kube-system   kube-controller-manager-master2   1/1     Running   1          79m
kube-system   kube-flannel-ds-hn8bc             1/1     Running   0          46m
kube-system   kube-flannel-ds-tf6kn             1/1     Running   0          11m
kube-system   kube-proxy-722xp                  1/1     Running   0          79m
kube-system   kube-proxy-dxfdx                  1/1     Running   0          11m
kube-system   kube-scheduler-master1            1/1     Running   0          11m
kube-system   kube-scheduler-master2            1/1     Running   1          79m
加入Kubernetes Node
在node1上执行
向集群添加新节点,执行在kubeadm init输出的kubeadm join命令:
kubeadm join master.k8s.io:16443 --token utehrv.1bcxxsecjilacgf5 --discovery-token-ca-cert-hash sha256:7b34954f4a26987b9e56da871607a694581120142ae2814c313f50e9c77efc9d
遇到的错误:
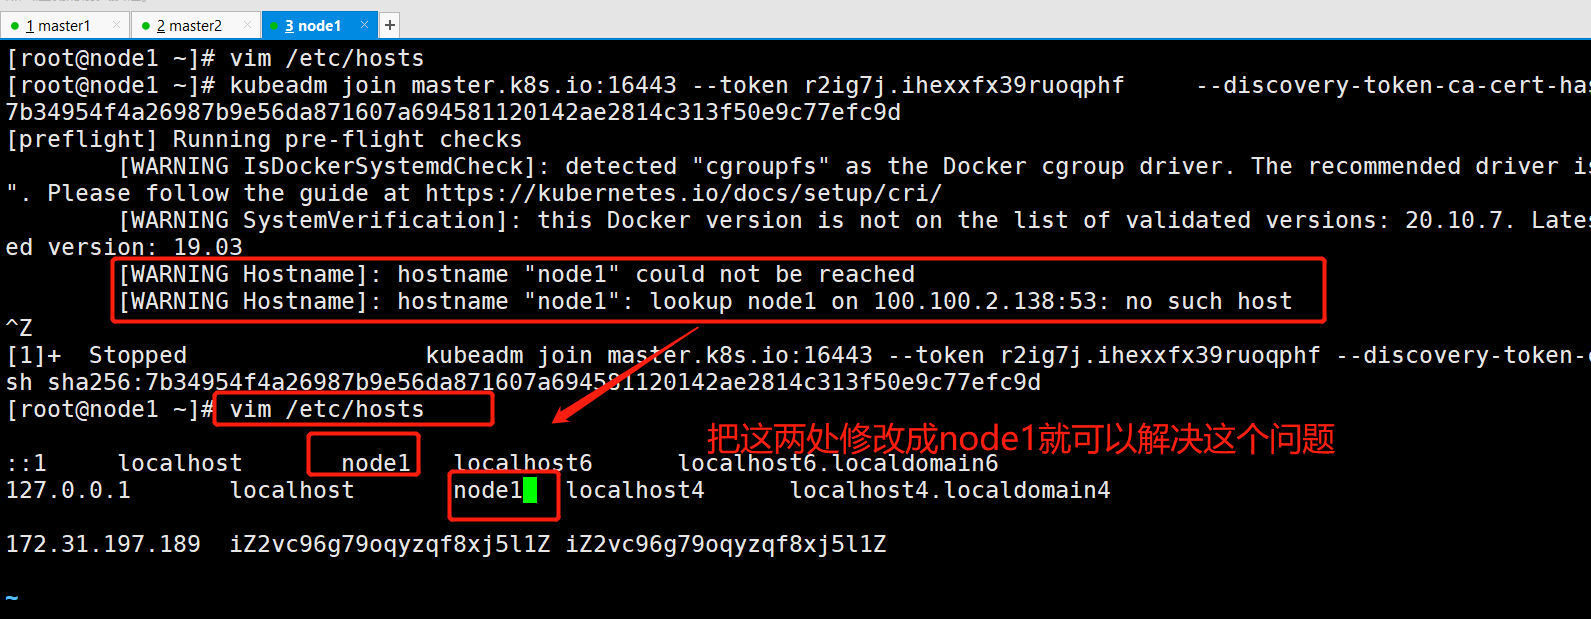
error execution phase preflight: couldn't validate the identity of the API Server: Get "https://master.k8s.io:16443/api/v1/namespaces/kube-public/configmaps/cluster-info?timeout=10s": dial tcp: lookup master.k8s.io on 100.100.2.138:53: no such host
#得到token
>kubeadm token create
#得到discovery-token-ca-cert-hash
> openssl x509 -pubkey -in /etc/kubernetes/pki/ca.crt | openssl rsa -pubin -outform der 2>/dev/null | openssl dgst -sha256 -hex | sed 's/^.* //'
也可以直接使用下面个命令,但是依然没有解决上面这个问题
# kubeadm token create --print-join-command
遇到的问题:
    [WARNING Hostname]: hostname "node1" could not be reached
    [WARNING Hostname]: hostname "node1": lookup node1 on 100.100.2.138:53: no such host
解决办法:
遇到的错误:
[WARNING IsDockerSystemdCheck]: detected "cgroupfs" as the Docker cgroup driver. The recommended driver is "systemd". Please follow the guide at https://kubernetes.io/docs/setup/cri/
解决办法
mkdir /etc/docker

# Setup daemon.
cat > /etc/docker/daemon.json <<EOF
{
  "exec-opts": ["native.cgroupdriver=systemd"],
  "log-driver": "json-file",
  "log-opts": {
    "max-size": "100m"
  },
  "storage-driver": "overlay2",
  "storage-opts": [
    "overlay2.override_kernel_check=true"
  ]
}
EOF

mkdir -p /etc/systemd/system/docker.service.d

# Restart Docker
systemctl daemon-reload
systemctl restart docker
遇到的错误(从节点未能加入到Master节点里面,网上查找的方法也没能解决):
[root@node1 ~]# kubeadm join master.k8s.io:16443 --token k5rf6v.ybl0dndn1l3xs5if     --discovery-token-ca-cert-hash sha256:7b34954f4a26987b9e56da871607a694581120142ae2814c313f50e9c77efc9d
[preflight] Running pre-flight checks
    [WARNING SystemVerification]: this Docker version is not on the list of validated versions: 20.10.7. Latest validated version: 19.03
error execution phase preflight: couldn't validate the identity of the API Server: Get "https://master.k8s.io:16443/api/v1/namespaces/kube-public/configmaps/cluster-info?timeout=10s": dial tcp: lookup master.k8s.io on 100.100.2.138:53: no such host
To see the stack trace of this error execute with --v=5 or higher
在master2上查看token
[root@master2 flannel]# kubeadm token list
TOKEN                     TTL         EXPIRES                     USAGES                   DESCRIPTION                                                EXTRA GROUPS
cjqgba.30wm6rmr5sug6avq   23h         2021-06-15T11:00:32+08:00   authentication,signing   <none>                                                     system:bootstrappers:kubeadm:default-node-token
rijbv2.50zq7e6zkpixxcg4   21h         2021-06-15T09:21:44+08:00   authentication,signing   <none>                                                     system:bootstrappers:kubeadm:default-node-token
rwnmlr.06ncpu0wtko1q50v   23h         2021-06-15T11:12:10+08:00   authentication,signing   <none>                                                     system:bootstrappers:kubeadm:default-node-token
集群网络重新安装,因为添加了新的node节点,这里的操作相当于在我的master2节点的操作
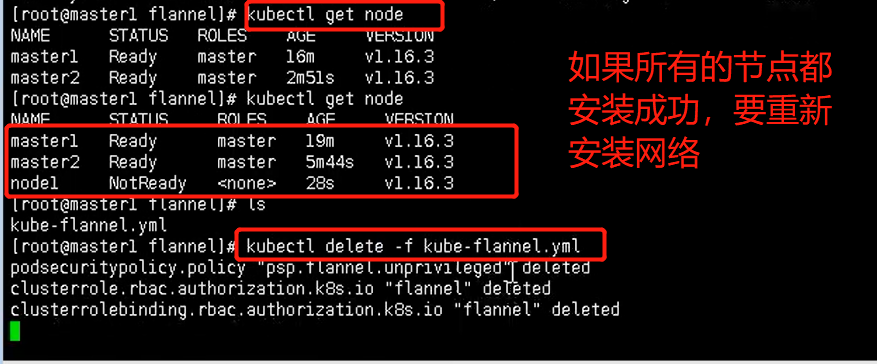

检查状态
kubectl get node

kubectl get pods --all-namespaces
测试kubernetes集群
在Kubernetes集群中创建一个pod,验证是否正常运行:(相当于在master2节点中进行这些操作)
$ kubectl create deployment nginx --image=nginx
$ kubectl expose deployment nginx --port=80 --type=NodePort
$ kubectl get pod,svc
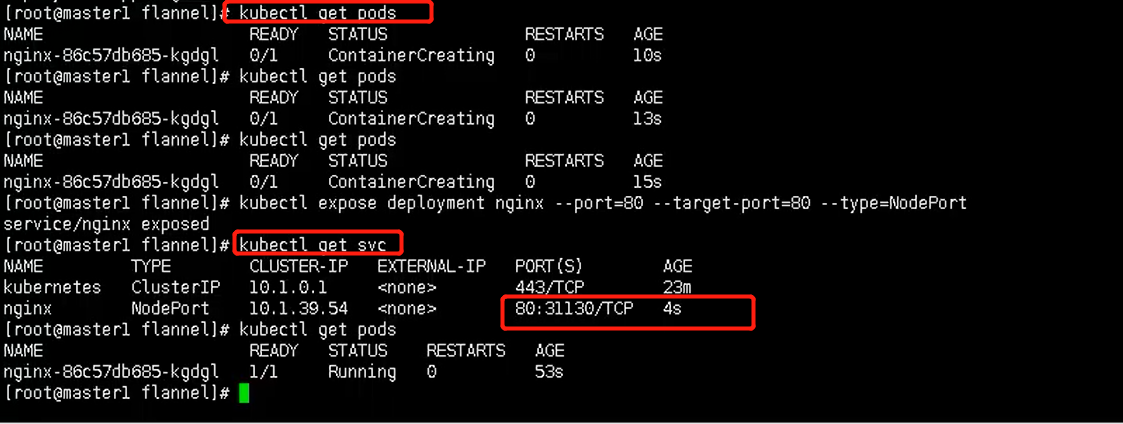
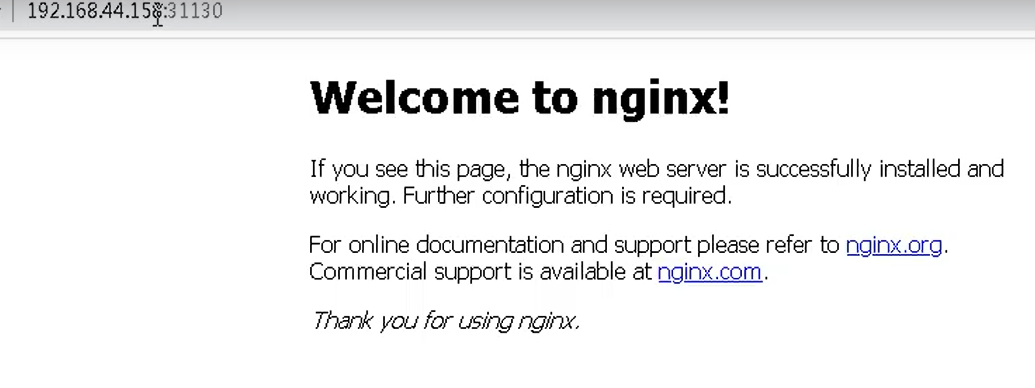
这里还可以通过虚拟ip进行访问
访问地址:http://NodeIP:Port
B站学习网址:k8s教程由浅入深-尚硅谷_哔哩哔哩_bilibili
https://www.bilibili.com/video/BV1GT4y1A756?p=55&spm_id_from=pageDriver&vd_source=b8d03deb535c0310c92cb2a2bcaa3a28