Jmeter+grafana+influxdb 搭建可视化性能测试监控平台
用途:监控Jmeter发送的数据成功量,总量,吞吐量等
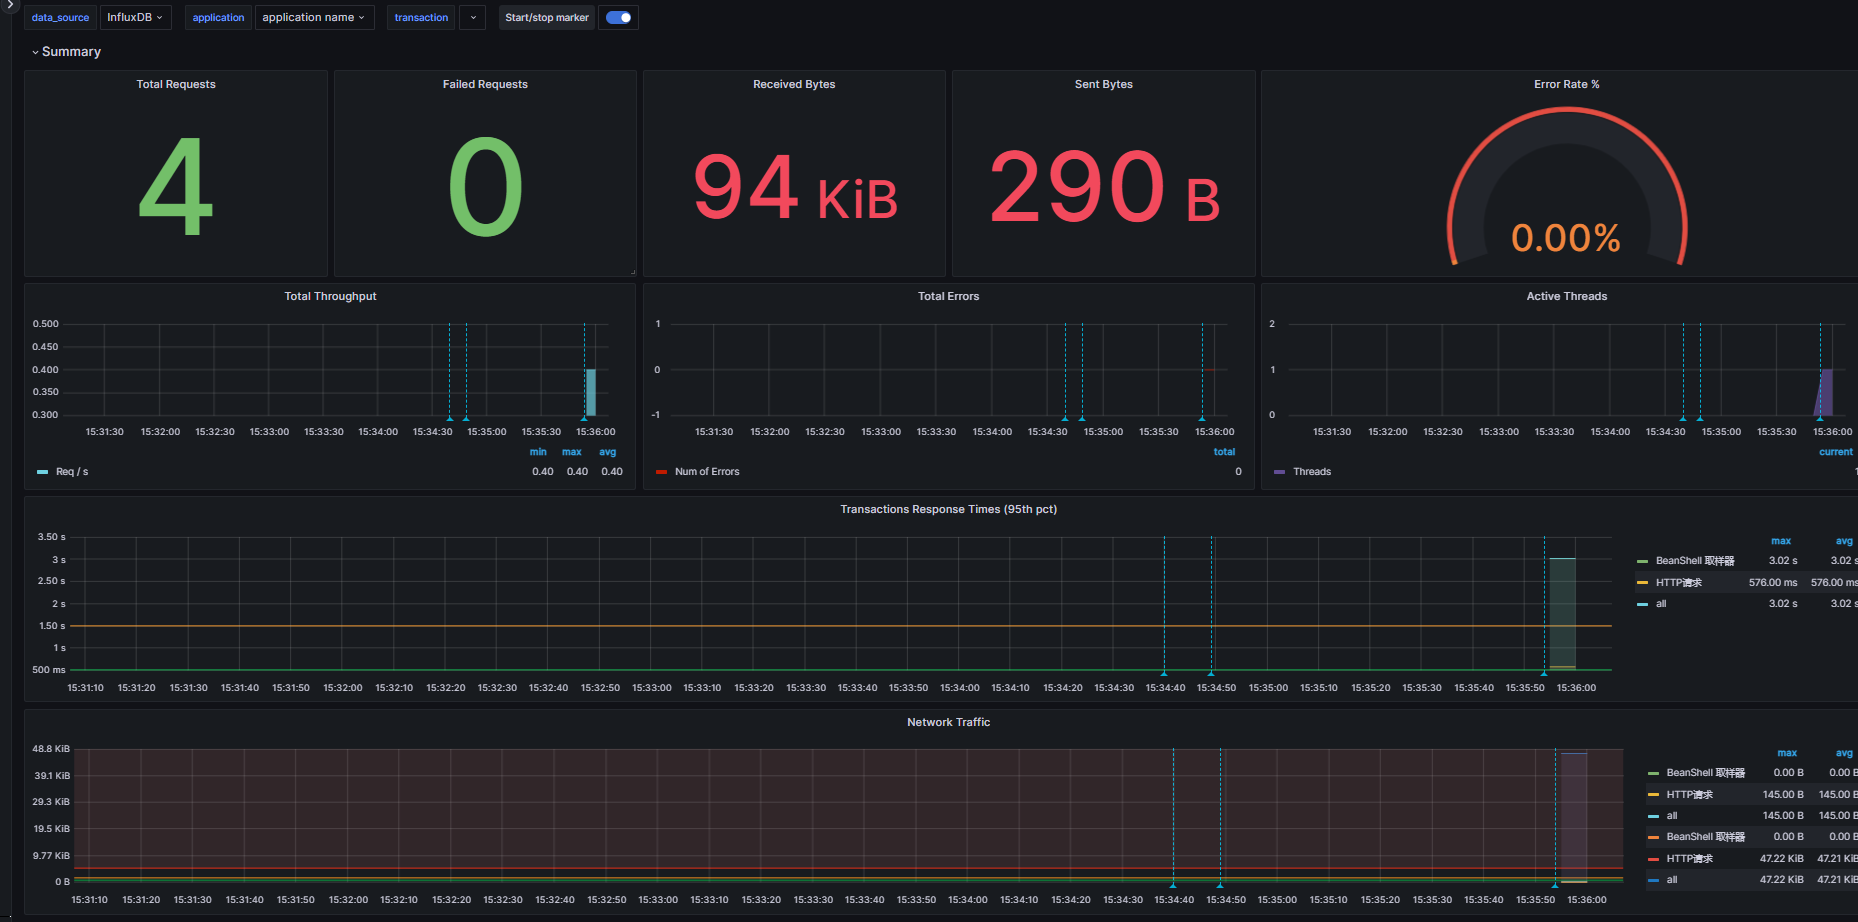
效果图:
1、grafana的安装
#获取grafana
> wget https://dl.grafana.com/enterprise/release/grafana-enterprise-9.4.3-1.x86_64.rpm
# 安装grafana
> rpm  install grafana-enterprise-9.4.3-1.x86_64.rpm --force --nodeps
> systemctl enable grafana-server && systemctl start grafana-server
> netstat -nuptl|grep 3000
访问grafana, http://ip:3000/
2、influxdb 安装
#下载
》  wget https://dl.influxdata.com/influxdb/releases/influxdb-1.8.2.x86_64.rpm
# 安装
》 yum localinstall influxdb-1.8.2.x86_64.rpm
#启动
》 systemctl start influxdb
#设置开机自启
》 systemctl enable influxdb
#查看influxdb状态
》 systemctl status influxdb
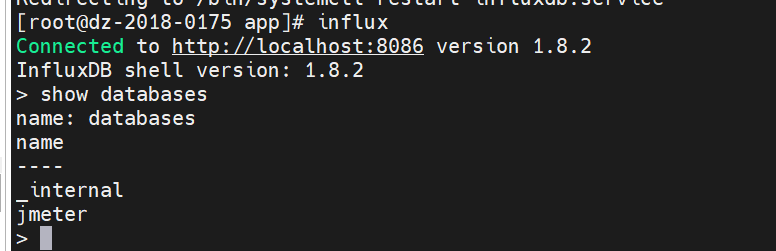
3、在influxdb 创建数据库
# 在控制台输入influx
> influx
# 创建数据库
> create database jmeter
> show databases
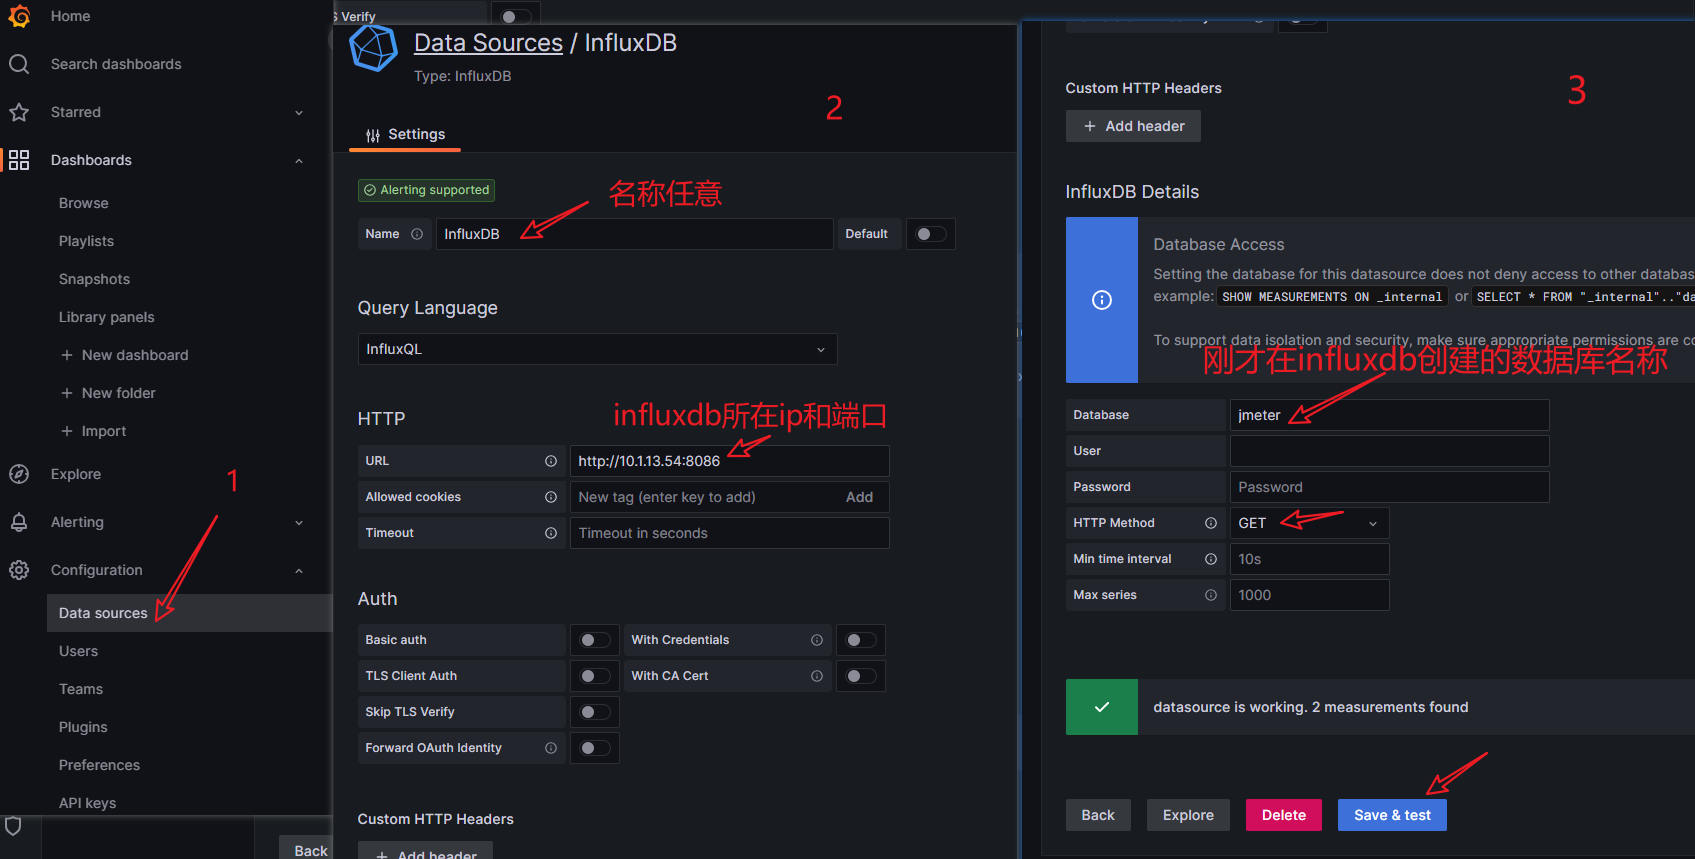
4、在grafana上面配置influxdb
2)Grafana使用模板文件创建仪表盘,加载jmeter的数据显示模板,
下载模板:访问链接下载模板文件,下载的模板文件官网: https://grafana.com/grafana/dashboards


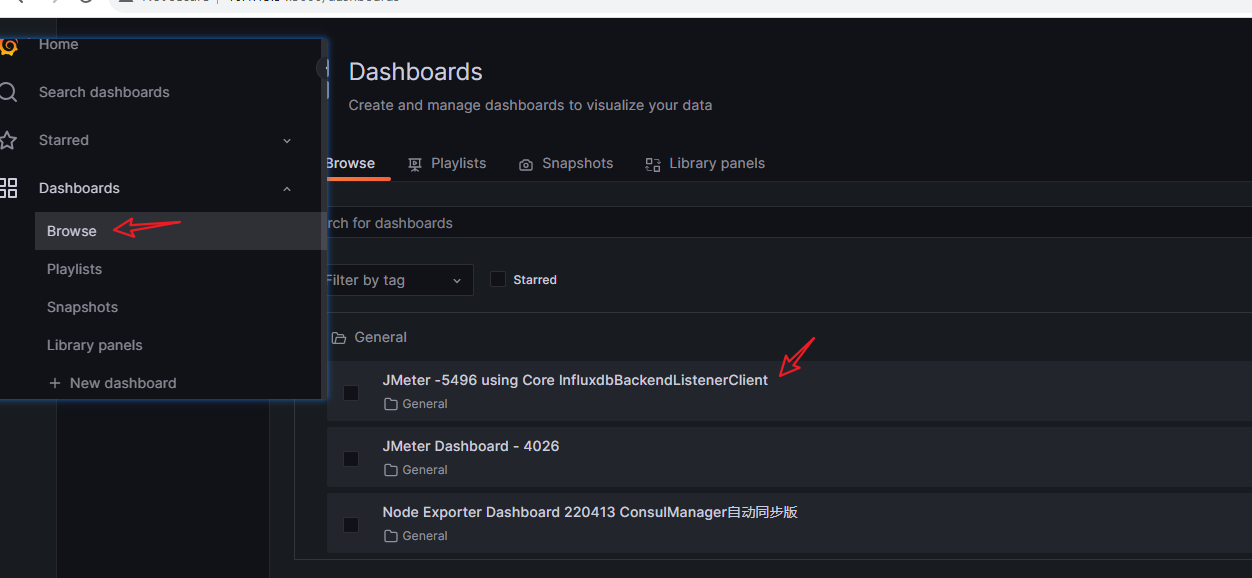
3)查看刚才创建的数据显示模板
4 、 jmeter配置向influxdb传送数据
创建线程组,设置循环次数为永远,添加一个http请求,就可以一直发送请求了;

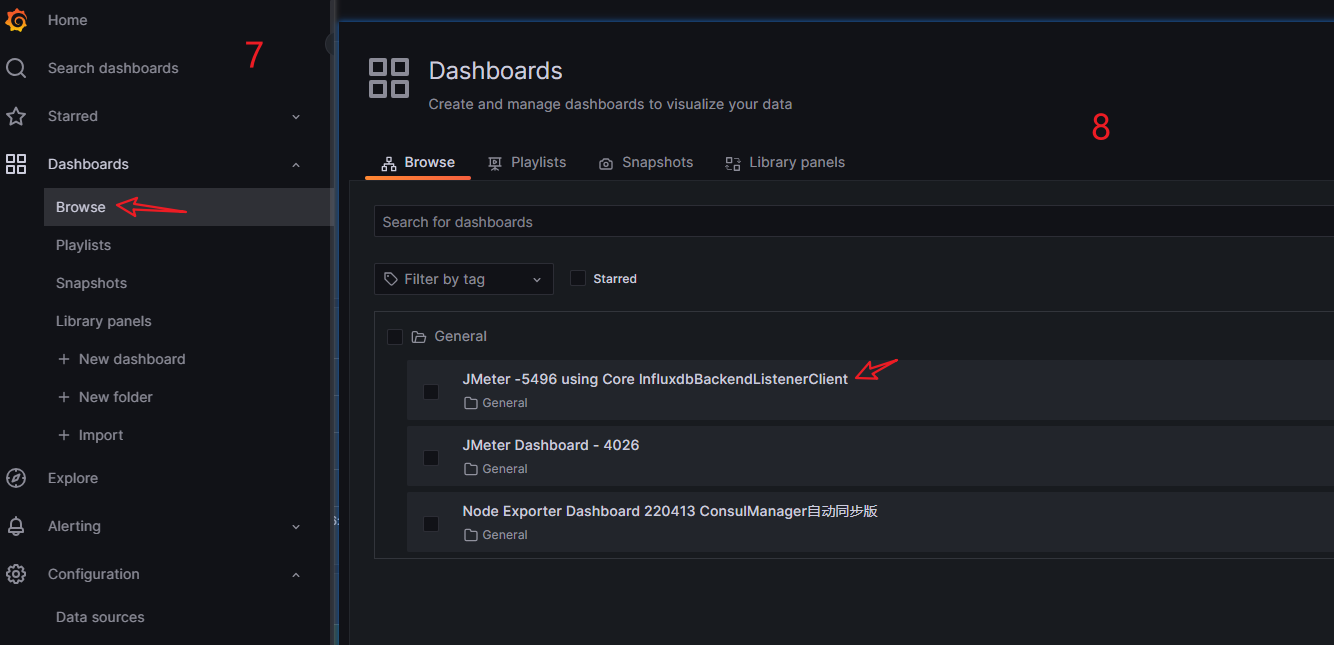
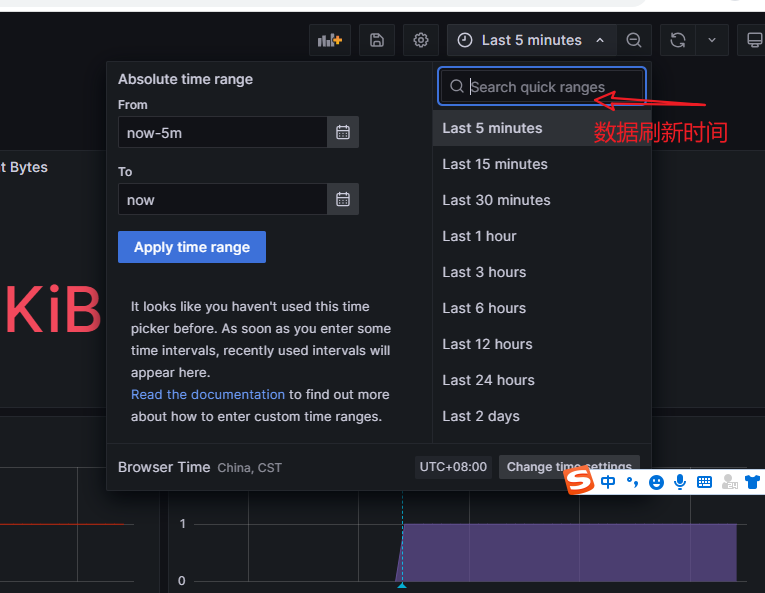
5、进入grafana查看数据
2)
--》结果预览

参考:
参考:
https://www.cnblogs.com/uncleyong/p/11885192.html#_label1
https://blog.csdn.net/qq_37688023/article/details/106440503
https://blog.csdn.net/Duo_Y/article/details/129631156
https://qainsights.com/jmeter-prometheus-and-grafana-integration/
二次改造模板
https://cloud.tencent.com/developer/article/1825275