2023.8.21-2023.8.27暑假第七周博客
2023.8.21
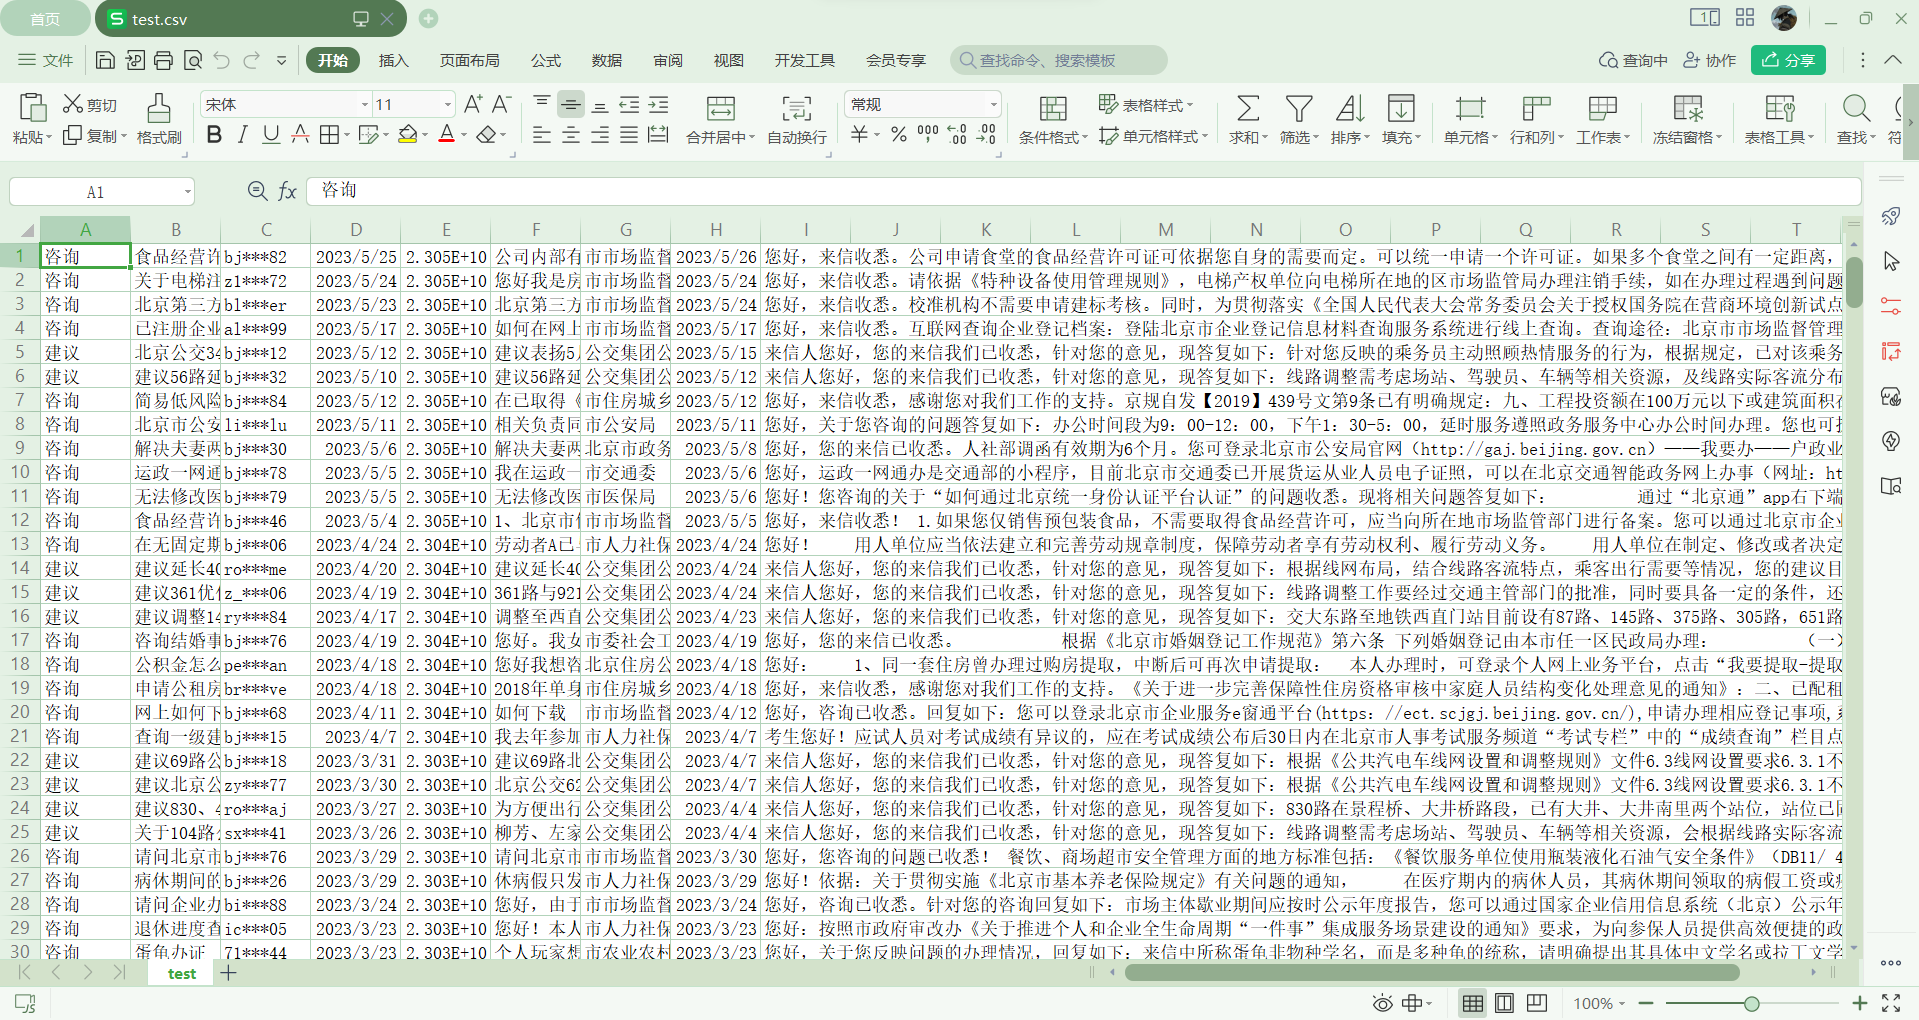
今天主要是对mapreduce进行了一个了解,主要是对爬取下来的数据进行清洗的过程
在本次的过程中,由于爬取的内容比较规整,因此采用的excel进行处理
mapreduce在我的理解中,对数据进行的是预处理,即把数据变得规整便于处理
map阶段就是写对数据处理,即你想怎么优化这些数据
reduce阶段就是输出数据
最近要开始做信息化领域热词分析了
2023.8.22
今天爬取了博客园的首页中的热点新闻,爬取的过程参考了学长的代码,整体来说还是比较顺利,之后是对爬取下来的内容做了一个排序和输出
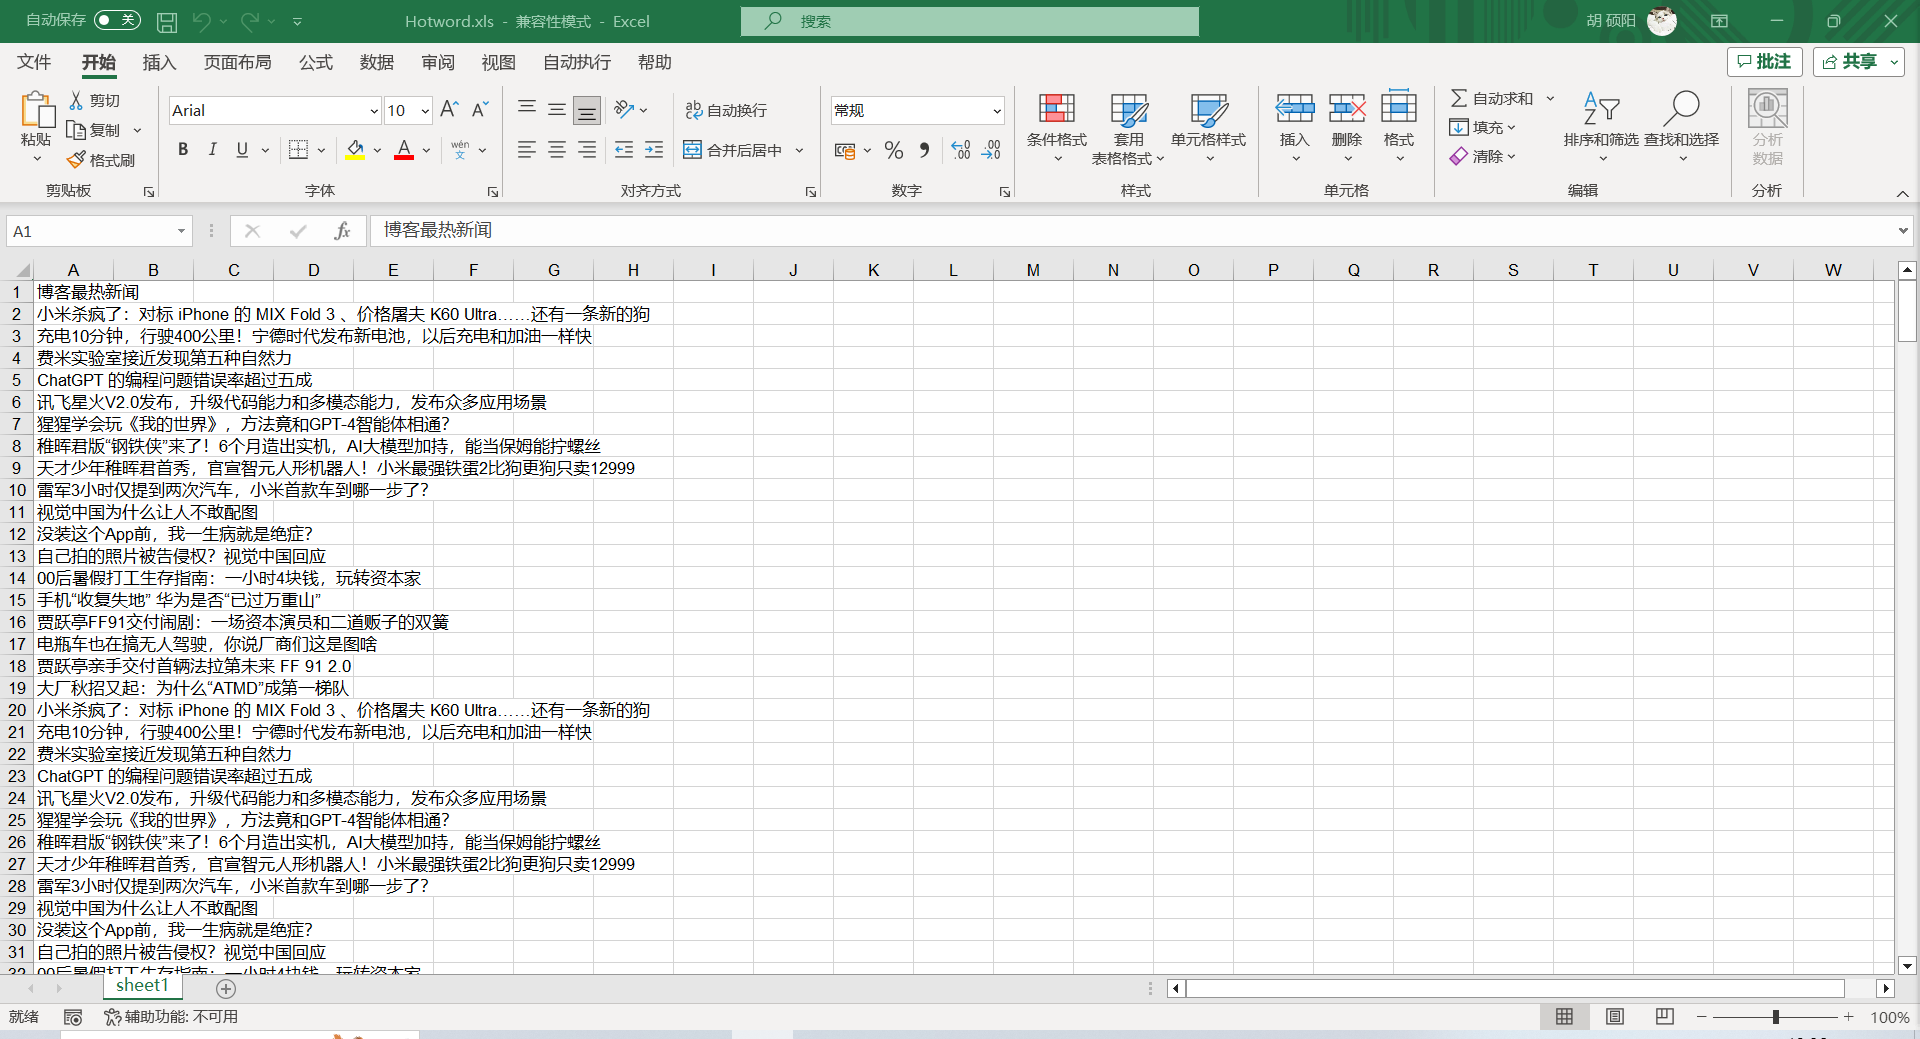
爬取下来的内容大概就是这些
import re
import xlwt
url = 'https://news.cnblogs.com/n/digg'
headers = {
"user-agent": "Mozilla/5.0 (Windows NT 10.0; WOW64) AppleWebKit/537.36 (KHTML, like Gecko) Chrome/77.0.3865.90 Safari/537.36"
}
def get_page(url):
try:
response = requests.get(url, headers=headers)
if response.status_code == 200:
print('获取网页成功')
print(response.encoding)
return response.text
else:
print('获取网页失败')
except Exception as e:
print(e)
f = xlwt.Workbook(encoding='utf-8')
sheet01 = f.add_sheet(u'sheet1', cell_overwrite_ok=True)
sheet01.write(0, 0, '博客最热新闻') # 第一行第一列
urls = ['https://news.cnblogs.com/n/digg?page={}'.format(i * 1) for i in range(100)]
temp=0
num=0
for url in urls:
print(url)
page = get_page(url)
items = re.findall('<h2 class="news_entry">.*?<a href=".*?" target="_blank">(.*?)</a>',page,re.S)
print(len(items))
print(items)
for i in range(len(items)):
sheet01.write(temp + i + 1, 0, items[i])
temp += len(items)
num+=1
print("已打印完第"+str(num)+"页")
print("打印完!!!")
f.save('Hotword.xls')
import pandas as pd
import re
import mysql.connector
from collections import Counter
if __name__ == '__main__':
filehandle = open("data.txt", "r", encoding='UTF-8');
mystr = filehandle.read()
seg_list = jieba.cut(mystr) # 默认是精确模式
print(seg_list)
stopwords = ['的', ',', ')', '(', '-', '.', '—', ':', '之', '(', ')', '?', '和', '使用', '实现', '、', '与', '!', '你', '了', '中',
'】', '【', '中国', '发布', '公司', '首次', '全球', '正式', '2019', '2020', '亿美元', '20', '10', '&#', '首个', '正在', '最大',
'成为', '第一', '这', '个', '如何', '人类', '什么', '一个', '宣布', '可能', '推出', '没有', '地球', '到底', '回应', '50', '100', '可以',
'开始', '这个', '问题', '为什么', '我们', '背后', '终于', '重磅', '160', '国内', '需要', '为何', '亿元', '发现', '成功', '最强', '不是', '人生']
c = Counter()
for x in seg_list:
if x not in stopwords:
if len(x) > 1 and x != '\r\n':
c[x] += 1
print('\n词频统计结果:')
f = open("finalwords.txt", 'w', encoding='utf-8')
f2 = open("finalnumber.txt", 'w', encoding='utf-8')
for (k, v) in c.most_common(100): # 输出词频最高的前两个词
print("%s:%d" % (k, v))
words = k
number = str(v)
f.write( words )
f2.write(number)
line = '\n'
f.write( line )
f2.write(line)
f.close()
filehandle.close();
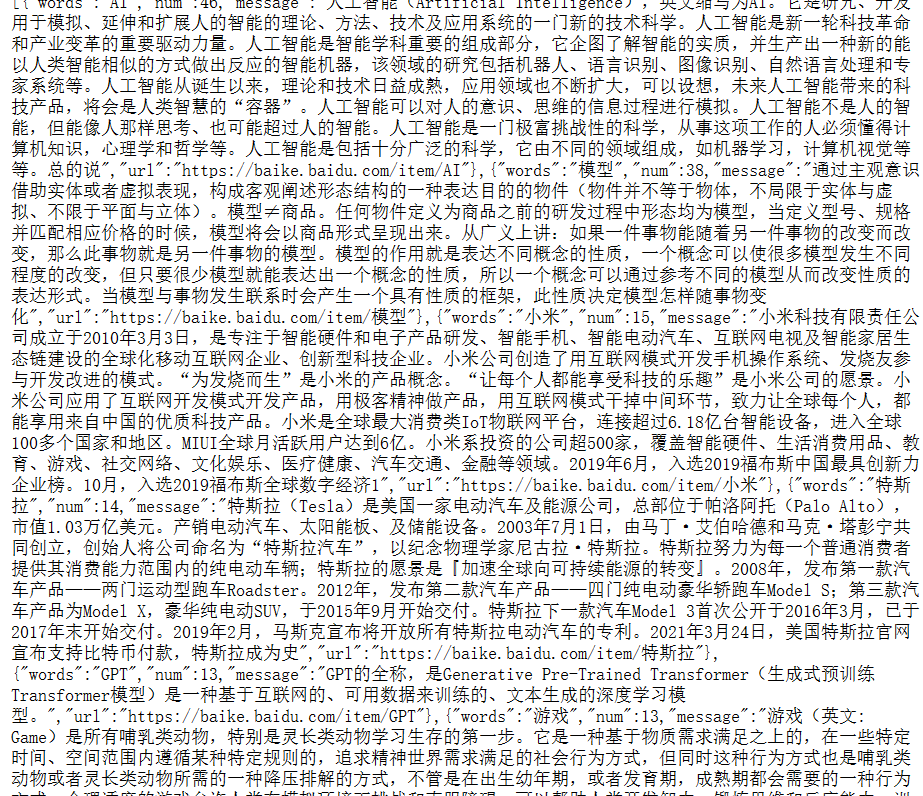
都是数据库中爬取到的内容
2023.8.25
今天继续做昨日的可视化,在昨天已经实现了获取数据库中数据的基础上,教程中是做了一个柱状图,我想先做一个柱状图出来看看效果,因此就跟着一起做了,这里引入了两个文件 一个是echarts-min.js,一个是jquery-3.5.1.min.js,这两个文件都是用于实现可视化的,同时我发现不知道为什么我的springboot项目下没有static和templates文件夹,因此
我需要自己创建,把上述两个文件放到static/js 文件夹下,在templates下创建了index.html
这时最坑爹的来了,页面404,就很无语,但是我查找半天没有结果,最终找了学长帮我调整了一下代码,可能还是自己没学过就直接上手,之后打开运行,确实没报错,显示了
echarts的标题,但是页面一片空白,一检查网页发现是无法加载js文件,普通的引入无法
加载,在学长的帮助下使用了一个themeleaf
添加了 <dependency>
<groupId>org.springframework.boot</groupId>
<artifactId>spring-boot-starter-thymeleaf</artifactId>
</dependency>
然后在html的头文件添加xmlns:th="http://www.thymeleaf.org"
其实我自己也感觉出是路径的问题了
学长告诉我这是一个类似vue的模板引擎,是springboot原生的,在springboot中
一般不能用写html的方式写引用,因为不是分目录的关系,当运行了html文件后
它会和js文件夹并级,index放在template文件夹目录下的时候会有保护,就访问不到
js文件了,因此需要用到themeleaf,这里也把引用的代码放上来
<script th:src="@{js/jquery-3.5.1.min.js}"></script>
<script th:src="@{js/echarts.min.js}"></script>
<script th:src="@{js/echarts-wordcloud.min.js}"></script>
了解之后深感springboot的伟大,因此打算学习spring boot了
今日解决了引用的问题,明日就着手做出词云图。
2023.8.26
今日在昨日调整过后 成功做出了词云图